Investing in Tryg (CPH:TRYG) five years ago would have delivered you a 7.6% gain


The main aim of stock picking is to find the market-beating stocks. But in any portfolio, there will be mixed results between individual stocks. At this point some shareholders may be questioning their investment in Tryg A/S (CPH:TRYG), since the last five years saw the share price fall 32%.
Since shareholders are down over the longer term, lets look at the underlying fundamentals over the that time and see if they've been consistent with returns.
See our latest analysis for Tryg
While the efficient markets hypothesis continues to be taught by some, it has been proven that markets are over-reactive dynamic systems, and investors are not always rational. One imperfect but simple way to consider how the market perception of a company has shifted is to compare the change in the earnings per share (EPS) with the share price movement.
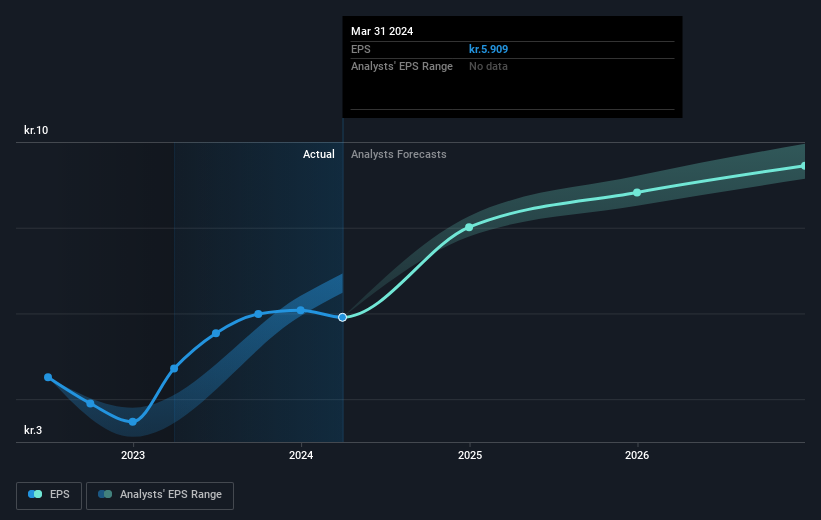
Looking back five years, both Tryg's share price and EPS declined; the latter at a rate of 2.7% per year. This reduction in EPS is less than the 7% annual reduction in the share price. This implies that the market is more cautious about the business these days.
You can see how EPS has changed over time in the image below (click on the chart to see the exact values).
We consider it positive that insiders have made significant purchases in the last year. Even so, future earnings will be far more important to whether current shareholders make money. Dive deeper into the earnings by checking this interactive graph of Tryg's earnings, revenue and cash flow.
What About Dividends?
As well as measuring the share price return, investors should also consider the total shareholder return (TSR). The TSR is a return calculation that accounts for the value of cash dividends (assuming that any dividend received was reinvested) and the calculated value of any discounted capital raisings and spin-offs. So for companies that pay a generous dividend, the TSR is often a lot higher than the share price return. In the case of Tryg, it has a TSR of 7.6% for the last 5 years. That exceeds its share price return that we previously mentioned. The dividends paid by the company have thusly boosted the total shareholder return.
A Different Perspective
Tryg shareholders gained a total return of 7.9% during the year. But that was short of the market average. On the bright side, that's still a gain, and it's actually better than the average return of 1.5% over half a decade This could indicate that the company is winning over new investors, as it pursues its strategy. It's always interesting to track share price performance over the longer term. But to understand Tryg better, we need to consider many other factors. Case in point: We've spotted 1 warning sign for Tryg you should be aware of.
There are plenty of other companies that have insiders buying up shares. You probably do not want to miss this free list of undervalued small cap companies that insiders are buying.
Please note, the market returns quoted in this article reflect the market weighted average returns of stocks that currently trade on Danish exchanges.
Valuation is complex, but we're here to simplify it.
Discover if Tryg might be undervalued or overvalued with our detailed analysis, featuring fair value estimates, potential risks, dividends, insider trades, and its financial condition.
Access Free AnalysisHave feedback on this article? Concerned about the content? Get in touch with us directly. Alternatively, email editorial-team (at) simplywallst.com.
This article by Simply Wall St is general in nature. We provide commentary based on historical data and analyst forecasts only using an unbiased methodology and our articles are not intended to be financial advice. It does not constitute a recommendation to buy or sell any stock, and does not take account of your objectives, or your financial situation. We aim to bring you long-term focused analysis driven by fundamental data. Note that our analysis may not factor in the latest price-sensitive company announcements or qualitative material. Simply Wall St has no position in any stocks mentioned.
Have feedback on this article? Concerned about the content? Get in touch with us directly. Alternatively, email editorial-team@simplywallst.com
About CPSE:TRYG
Tryg
Provides insurance products and services for private and corporate customers, and small and medium-sized businesses in Denmark, Sweden, and Norway.
Solid track record with excellent balance sheet.

