

Key Insights
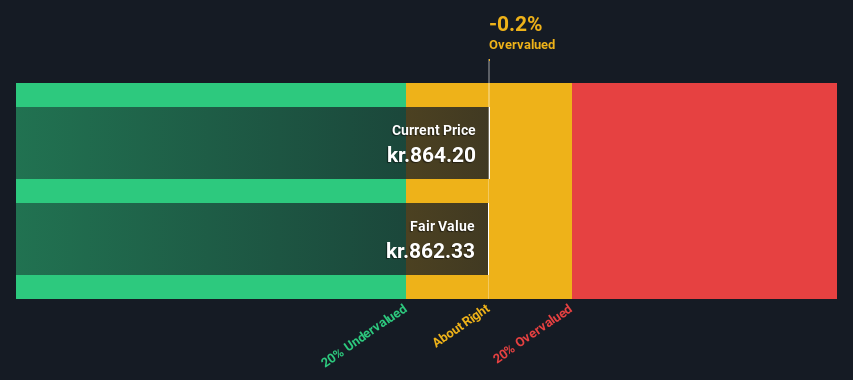
- The projected fair value for Coloplast is kr.862 based on 2 Stage Free Cash Flow to Equity
- Current share price of kr.864 suggests Coloplast is potentially trading close to its fair value
- Analyst price target for COLO B is kr.917, which is 6.3% above our fair value estimate
In this article we are going to estimate the intrinsic value of Coloplast A/S (CPH:COLO B) by taking the forecast future cash flows of the company and discounting them back to today's value. The Discounted Cash Flow (DCF) model is the tool we will apply to do this. It may sound complicated, but actually it is quite simple!
We generally believe that a company's value is the present value of all of the cash it will generate in the future. However, a DCF is just one valuation metric among many, and it is not without flaws. For those who are keen learners of equity analysis, the Simply Wall St analysis model here may be something of interest to you.
View our latest analysis for Coloplast
Crunching The Numbers
We are going to use a two-stage DCF model, which, as the name states, takes into account two stages of growth. The first stage is generally a higher growth period which levels off heading towards the terminal value, captured in the second 'steady growth' period. To begin with, we have to get estimates of the next ten years of cash flows. Where possible we use analyst estimates, but when these aren't available we extrapolate the previous free cash flow (FCF) from the last estimate or reported value. We assume companies with shrinking free cash flow will slow their rate of shrinkage, and that companies with growing free cash flow will see their growth rate slow, over this period. We do this to reflect that growth tends to slow more in the early years than it does in later years.
A DCF is all about the idea that a dollar in the future is less valuable than a dollar today, and so the sum of these future cash flows is then discounted to today's value:
10-year free cash flow (FCF) forecast
| 2024 | 2025 | 2026 | 2027 | 2028 | 2029 | 2030 | 2031 | 2032 | 2033 | |
| Levered FCF (DKK, Millions) | kr.4.68b | kr.6.06b | kr.6.78b | kr.7.66b | kr.8.34b | kr.8.81b | kr.9.18b | kr.9.48b | kr.9.71b | kr.9.90b |
| Growth Rate Estimate Source | Analyst x8 | Analyst x8 | Analyst x8 | Analyst x3 | Analyst x1 | Est @ 5.68% | Est @ 4.21% | Est @ 3.18% | Est @ 2.46% | Est @ 1.96% |
| Present Value (DKK, Millions) Discounted @ 5.2% | kr.4.4k | kr.5.5k | kr.5.8k | kr.6.2k | kr.6.5k | kr.6.5k | kr.6.4k | kr.6.3k | kr.6.1k | kr.5.9k |
("Est" = FCF growth rate estimated by Simply Wall St)
Present Value of 10-year Cash Flow (PVCF) = kr.60b
We now need to calculate the Terminal Value, which accounts for all the future cash flows after this ten year period. For a number of reasons a very conservative growth rate is used that cannot exceed that of a country's GDP growth. In this case we have used the 5-year average of the 10-year government bond yield (0.8%) to estimate future growth. In the same way as with the 10-year 'growth' period, we discount future cash flows to today's value, using a cost of equity of 5.2%.
Terminal Value (TV)= FCF2033 × (1 + g) ÷ (r – g) = kr.9.9b× (1 + 0.8%) ÷ (5.2%– 0.8%) = kr.224b
Present Value of Terminal Value (PVTV)= TV / (1 + r)10= kr.224b÷ ( 1 + 5.2%)10= kr.134b
The total value is the sum of cash flows for the next ten years plus the discounted terminal value, which results in the Total Equity Value, which in this case is kr.194b. To get the intrinsic value per share, we divide this by the total number of shares outstanding. Relative to the current share price of kr.864, the company appears around fair value at the time of writing. Valuations are imprecise instruments though, rather like a telescope - move a few degrees and end up in a different galaxy. Do keep this in mind.
Important Assumptions
The calculation above is very dependent on two assumptions. The first is the discount rate and the other is the cash flows. If you don't agree with these result, have a go at the calculation yourself and play with the assumptions. The DCF also does not consider the possible cyclicality of an industry, or a company's future capital requirements, so it does not give a full picture of a company's potential performance. Given that we are looking at Coloplast as potential shareholders, the cost of equity is used as the discount rate, rather than the cost of capital (or weighted average cost of capital, WACC) which accounts for debt. In this calculation we've used 5.2%, which is based on a levered beta of 0.970. Beta is a measure of a stock's volatility, compared to the market as a whole. We get our beta from the industry average beta of globally comparable companies, with an imposed limit between 0.8 and 2.0, which is a reasonable range for a stable business.
SWOT Analysis for Coloplast
- Earnings growth over the past year exceeded the industry.
- Debt is well covered by earnings and cashflows.
- Dividend is low compared to the top 25% of dividend payers in the Medical Equipment market.
- Expensive based on P/E ratio and estimated fair value.
- Shareholders have been diluted in the past year.
- Annual earnings are forecast to grow for the next 3 years.
- Dividends are not covered by earnings and cashflows.
- Annual earnings are forecast to grow slower than the Danish market.
Looking Ahead:
Whilst important, the DCF calculation ideally won't be the sole piece of analysis you scrutinize for a company. DCF models are not the be-all and end-all of investment valuation. Preferably you'd apply different cases and assumptions and see how they would impact the company's valuation. If a company grows at a different rate, or if its cost of equity or risk free rate changes sharply, the output can look very different. For Coloplast, we've compiled three fundamental aspects you should look at:
- Risks: Be aware that Coloplast is showing 3 warning signs in our investment analysis , and 1 of those is concerning...
- Management:Have insiders been ramping up their shares to take advantage of the market's sentiment for COLO B's future outlook? Check out our management and board analysis with insights on CEO compensation and governance factors.
- Other High Quality Alternatives: Do you like a good all-rounder? Explore our interactive list of high quality stocks to get an idea of what else is out there you may be missing!
PS. Simply Wall St updates its DCF calculation for every Danish stock every day, so if you want to find the intrinsic value of any other stock just search here.
New: AI Stock Screener & Alerts
Our new AI Stock Screener scans the market every day to uncover opportunities.
• Dividend Powerhouses (3%+ Yield)
• Undervalued Small Caps with Insider Buying
• High growth Tech and AI Companies
Or build your own from over 50 metrics.
Have feedback on this article? Concerned about the content? Get in touch with us directly. Alternatively, email editorial-team (at) simplywallst.com.
This article by Simply Wall St is general in nature. We provide commentary based on historical data and analyst forecasts only using an unbiased methodology and our articles are not intended to be financial advice. It does not constitute a recommendation to buy or sell any stock, and does not take account of your objectives, or your financial situation. We aim to bring you long-term focused analysis driven by fundamental data. Note that our analysis may not factor in the latest price-sensitive company announcements or qualitative material. Simply Wall St has no position in any stocks mentioned.
About CPSE:COLO B
Coloplast
Engages in the development and sale of intimate healthcare products and services in Denmark, the United States, the United Kingdom, France, and internationally.
Good value with moderate growth potential.

