- Denmark
- /
- Oil and Gas
- /
- CPSE:TRMD A
TORM (CPH:TRMD A) delivers shareholders massive 49% CAGR over 5 years, surging 5.1% in the last week alone

We think all investors should try to buy and hold high quality multi-year winners. And highest quality companies can see their share prices grow by huge amounts. Don't believe it? Then look at the TORM plc (CPH:TRMD A) share price. It's 365% higher than it was five years ago. This just goes to show the value creation that some businesses can achieve. Also pleasing for shareholders was the 11% gain in the last three months. But this could be related to the strong market, which is up 15% in the last three months.
Since the stock has added kr.1.1b to its market cap in the past week alone, let's see if underlying performance has been driving long-term returns.
See our latest analysis for TORM
To quote Buffett, 'Ships will sail around the world but the Flat Earth Society will flourish. There will continue to be wide discrepancies between price and value in the marketplace...' One way to examine how market sentiment has changed over time is to look at the interaction between a company's share price and its earnings per share (EPS).
During the last half decade, TORM became profitable. Sometimes, the start of profitability is a major inflection point that can signal fast earnings growth to come, which in turn justifies very strong share price gains. Given that the company made a profit three years ago, but not five years ago, it is worth looking at the share price returns over the last three years, too. We can see that the TORM share price is up 320% in the last three years. Meanwhile, EPS is up 81% per year. This EPS growth is higher than the 61% average annual increase in the share price over the same three years. Therefore, it seems the market has moderated its expectations for growth, somewhat. This unenthusiastic sentiment is reflected in the stock's reasonably modest P/E ratio of 5.01.
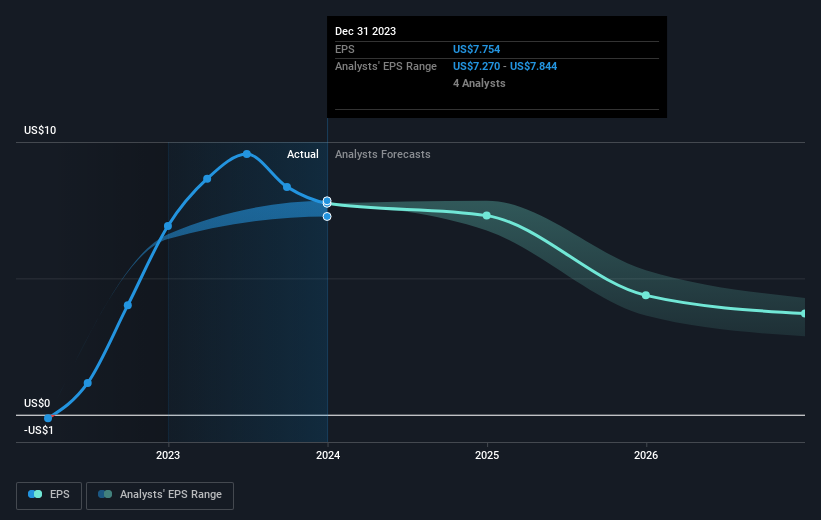
The company's earnings per share (over time) is depicted in the image below (click to see the exact numbers).
We know that TORM has improved its bottom line over the last three years, but what does the future have in store? This free interactive report on TORM's balance sheet strength is a great place to start, if you want to investigate the stock further.
What About Dividends?
It is important to consider the total shareholder return, as well as the share price return, for any given stock. Whereas the share price return only reflects the change in the share price, the TSR includes the value of dividends (assuming they were reinvested) and the benefit of any discounted capital raising or spin-off. Arguably, the TSR gives a more comprehensive picture of the return generated by a stock. In the case of TORM, it has a TSR of 623% for the last 5 years. That exceeds its share price return that we previously mentioned. And there's no prize for guessing that the dividend payments largely explain the divergence!
A Different Perspective
It's good to see that TORM has rewarded shareholders with a total shareholder return of 46% in the last twelve months. And that does include the dividend. Having said that, the five-year TSR of 49% a year, is even better. It's always interesting to track share price performance over the longer term. But to understand TORM better, we need to consider many other factors. Case in point: We've spotted 4 warning signs for TORM you should be aware of, and 1 of them is a bit unpleasant.
If you are like me, then you will not want to miss this free list of growing companies that insiders are buying.
Please note, the market returns quoted in this article reflect the market weighted average returns of stocks that currently trade on Danish exchanges.
Mobile Infrastructure for Defense and Disaster
The next wave in robotics isn't humanoid. Its fully autonomous towers delivering 5G, ISR, and radar in under 30 minutes, anywhere.
Get the investor briefing before the next round of contracts
Sponsored On Behalf of CiTechValuation is complex, but we're here to simplify it.
Discover if TORM might be undervalued or overvalued with our detailed analysis, featuring fair value estimates, potential risks, dividends, insider trades, and its financial condition.
Access Free AnalysisHave feedback on this article? Concerned about the content? Get in touch with us directly. Alternatively, email editorial-team (at) simplywallst.com.
This article by Simply Wall St is general in nature. We provide commentary based on historical data and analyst forecasts only using an unbiased methodology and our articles are not intended to be financial advice. It does not constitute a recommendation to buy or sell any stock, and does not take account of your objectives, or your financial situation. We aim to bring you long-term focused analysis driven by fundamental data. Note that our analysis may not factor in the latest price-sensitive company announcements or qualitative material. Simply Wall St has no position in any stocks mentioned.
About CPSE:TRMD A
TORM
A shipping company, owns and operates a fleet of product tankers in the United Kingdom.
Excellent balance sheet and good value.
Similar Companies
Market Insights

Weekly Picks

Early mover in a fast growing industry. Likely to experience share price volatility as they scale


A case for CA$31.80 (undiluted), aka 8,616% upside from CA$0.37 (an 86 bagger!).


Moderation and Stabilisation: HOLD: Fair Price based on a 4-year Cycle is $12.08
Recently Updated Narratives


An amazing opportunity to potentially get a 100 bagger

Amazon: Why the World’s Biggest Platform Still Runs on Invisible Economics

Sunrun Stock: When the Energy Transition Collides With the Cost of Capital
Popular Narratives


MicroVision will explode future revenue by 380.37% with a vision towards success


Crazy Undervalued 42 Baggers Silver Play (Active & Running Mine)


