Advertisement
- Denmark
- /
- Consumer Durables
- /
- CPSE:TCM
TCM Group (CPSE:TCM) Profit Margin Expands to 5.4%, Reinforcing Efficiency Narrative

Simply Wall St
Reviewed by Simply Wall St
TCM Group (CPSE:TCM) has just reported Q3 2025 results, posting revenue of 288.9 million DKK and basic EPS of 0.93 DKK, with net income at 9.6 million DKK for the quarter. Over the past twelve months, revenue has climbed from 1,189.4 million DKK to 1,247.5 million DKK, up 8.2% year-over-year. Net income rose from 29.8 million DKK to 66.9 million DKK, reflecting a 65.9% increase. With profit margins expanding and earnings momentum building, the latest numbers set the stage for investors to assess the quality and sustainability of TCM’s improving financial profile.
See our full analysis for TCM Group.Next, we will match these fresh results with the key narratives circulating in the investor community, putting some to the test and backing others with hard numbers.
See what the community is saying about TCM Group
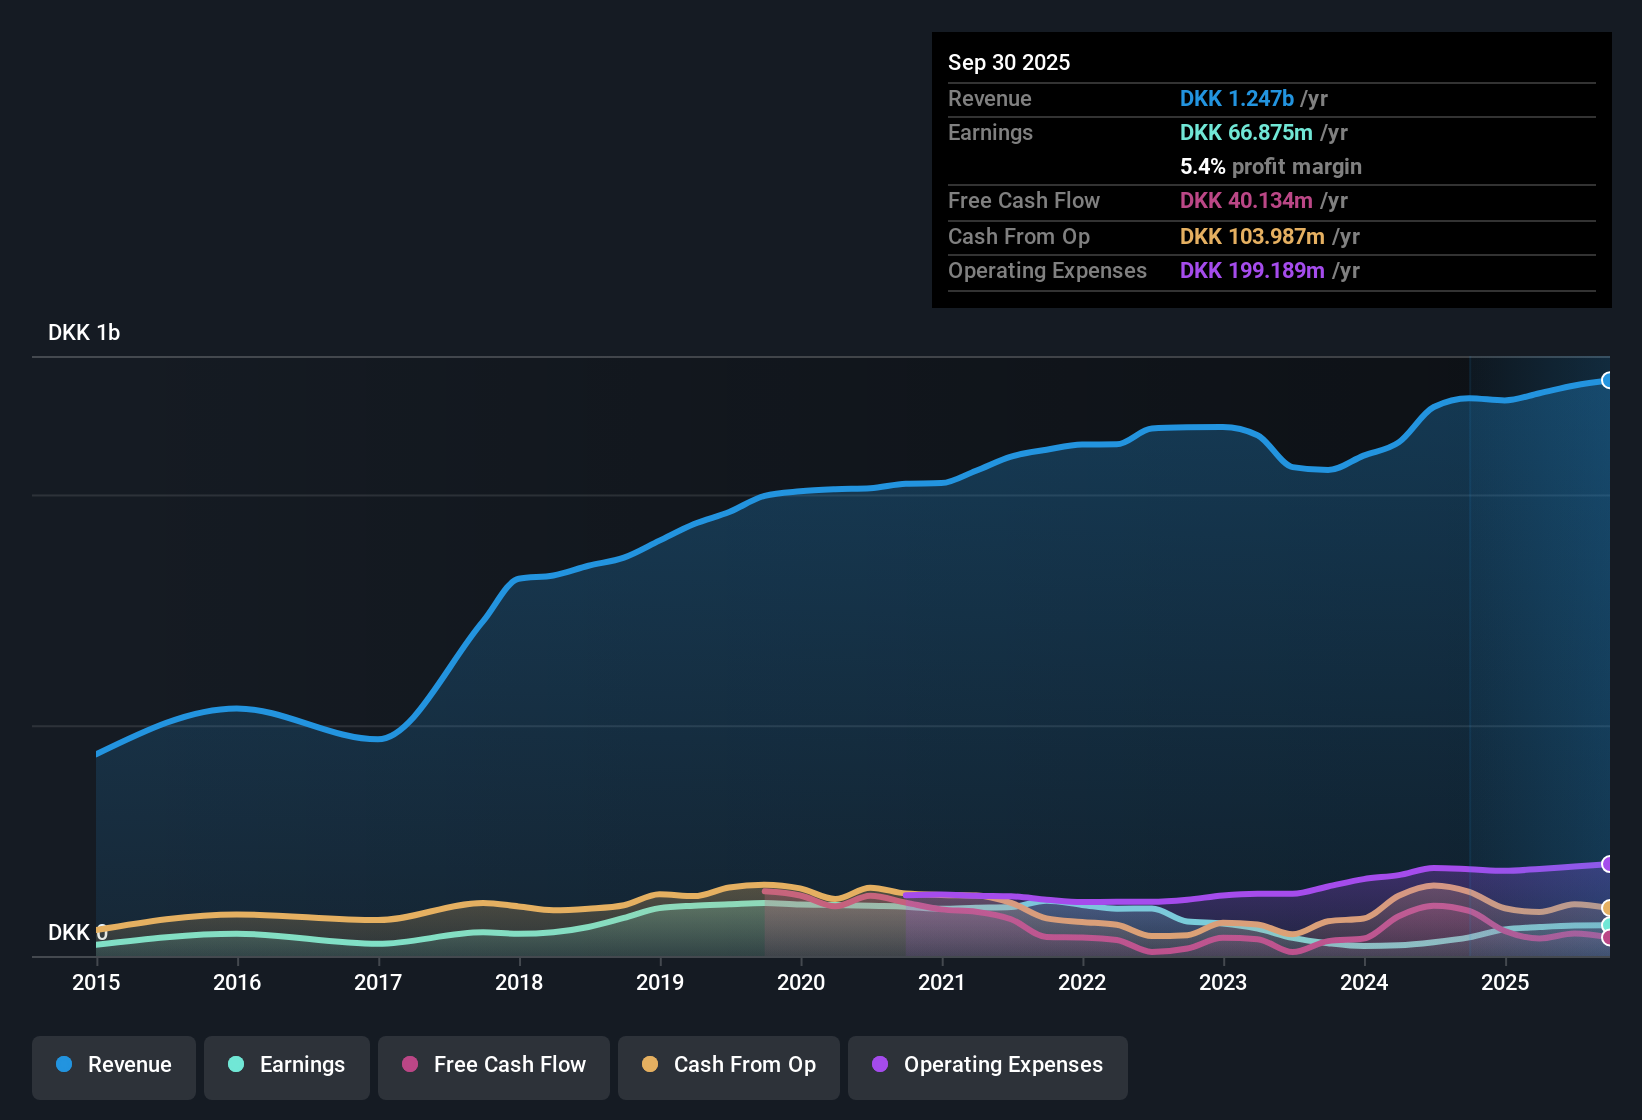
Profit Margin Hits 5.4% Milestone
- Trailing 12-month profit margin moved up from 3.3% to 5.4%, outpacing the Danish market's average and indicating more efficient operations in the past year.
- According to the consensus narrative, this improved margin profile is supported by digital investments and automation initiatives. Analysts note that these efforts contribute to both margin resilience and sustained revenue expansion.
- Profitability trends are connected to ongoing investments in digital distribution and automation. If these are maintained, they could lead to further efficiency and potential long-term top-line growth.
- However, potential margin compression remains a risk due to likely supplier cost increases in the second half, which could test earnings durability despite current momentum.
Consensus states that investors should watch how automation and digital expansion affect future margins. See the full stance in the consensus narrative for the latest evidence and debate. 📊 Read the full TCM Group Consensus Narrative.
Price-to-Earnings Ratio Signals Value
- TCM trades at a price-to-earnings ratio of 10.5x, which is well below both the European Consumer Durables industry average of 15.5x and its close peer group at 14.5x. This suggests the shares are at a meaningful discount to comparable companies.
- The consensus narrative highlights that analysts view TCM’s valuation as compelling, given that the company is also trading 66.4% below its DCF fair value of 201.92 and is expected to grow earnings at 24.3% per year, much higher than the 5% market average.
- This combination of a below-average PE ratio and faster growth expectations positions TCM among value opportunities for investors who are confident in the company’s ability to sustain its operational improvements.
- However, the share price of 67.8 remains well below the analyst target of 88.5. This indicates the market is looking for evidence that future margin expansion and growth can be achieved while managing execution or cost risks.
Debt Load and Dividend Instability Stand Out
- Management commentary and analysis highlight high financial leverage and an unstable dividend record, making debt and income reliability important considerations.
- The consensus narrative emphasizes that while robust earnings growth and margin gains are attracting attention, concerns persist. Heavy debt and dividend volatility remain key challenges for investors seeking greater financial stability.
- Critics point to TCM’s 81% revenue exposure to the Danish market, arguing that local economic fluctuations could have a significant effect on both earnings and dividend payouts.
- Consensus expects margin progress to support earnings resilience, but notes that higher costs from recent acquisitions and digital investments could impact profitability if expected efficiencies do not materialize.
Next Steps
To see how these results tie into long-term growth, risks, and valuation, check out the full range of community narratives for TCM Group on Simply Wall St. Add the company to your watchlist or portfolio so you'll be alerted when the story evolves.
Do you interpret the data another way? Take a few moments to share your perspective and build your own narrative in just minutes. Do it your way
A great starting point for your TCM Group research is our analysis highlighting 4 key rewards and 2 important warning signs that could impact your investment decision.
See What Else Is Out There
Despite margin improvements, TCM Group’s high leverage and unstable dividend may indicate underlying financial health issues that could challenge future reliability.
If you want to favor companies with stronger foundations, use our solid balance sheet and fundamentals stocks screener (1924 results) to discover those with lower debt and greater financial strength.
This article by Simply Wall St is general in nature. We provide commentary based on historical data and analyst forecasts only using an unbiased methodology and our articles are not intended to be financial advice. It does not constitute a recommendation to buy or sell any stock, and does not take account of your objectives, or your financial situation. We aim to bring you long-term focused analysis driven by fundamental data. Note that our analysis may not factor in the latest price-sensitive company announcements or qualitative material. Simply Wall St has no position in any stocks mentioned.
Valuation is complex, but we're here to simplify it.
Discover if TCM Group might be undervalued or overvalued with our detailed analysis, featuring fair value estimates, potential risks, dividends, insider trades, and its financial condition.
Access Free AnalysisHave feedback on this article? Concerned about the content? Get in touch with us directly. Alternatively, email editorial-team@simplywallst.com
About CPSE:TCM
TCM Group
Manufactures and sells kitchen and furniture products for bathrooms and storage in Denmark, Norway, and internationally.
Undervalued with reasonable growth potential.
Market Insights

Advertisement
Community Narratives
MicroVision will explode future revenue by 380.37% with a vision towards success
Fair Value US$60|98.4% undervalued
TH
Community Contributor
The Indispensable Artery for a New North American Economy
Fair Value CA$132.87|0.8% undervalued
TI
Community Contributor
Recently Updated Narratives
CO

composite32 on TAV Havalimanlari Holding ·
TAV Havalimanlari Holding will fly high with 25.68% revenue growth
Fair Value:₺545.1648.6% undervalued
3 followersusers have followed this narrative
0 commentsusers have commented on this narrative
0 likesusers have liked this narrative
RO


Robbo on Fiducian Group ·
Fiducian: Compliance Clouds or Value Opportunity?
Fair Value:AU$122.3% overvalued
1 followerusers have followed this narrative
0 commentsusers have commented on this narrative
0 likesusers have liked this narrative
MA


MarkoVT on COVER ·
Q3 Outlook modestly optimistic
Fair Value:JP¥1.65k2.0% overvalued
1 followerusers have followed this narrative
0 commentsusers have commented on this narrative
0 likesusers have liked this narrative
Popular Narratives
TH

TheWallstreetKing on MicroVision ·
MicroVision will explode future revenue by 380.37% with a vision towards success
Fair Value:US$6098.4% undervalued
93 followersusers have followed this narrative
10 commentsusers have commented on this narrative
18 likesusers have liked this narrative
OS


oscargarcia on Alphabet ·
The company that turned a verb into a global necessity and basically runs the modern internet, digital ads, smartphones, maps, and AI.
Fair Value:US$3405.9% undervalued
136 followersusers have followed this narrative
6 commentsusers have commented on this narrative
18 likesusers have liked this narrative
AN


AnalystConsensusTarget on NVIDIA ·
NVDA: Expanding AI Demand Will Drive Major Data Center Investments Through 2026
Fair Value:US$232.7922.6% undervalued
929 followersusers have followed this narrative
6 commentsusers have commented on this narrative
22 likesusers have liked this narrative