- Denmark
- /
- Consumer Durables
- /
- CPSE:TCM
Is TCM Group A/S'(CPH:TCM) Recent Stock Performance Tethered To Its Strong Fundamentals?


TCM Group (CPH:TCM) has had a great run on the share market with its stock up by a significant 13% over the last three months. Given the company's impressive performance, we decided to study its financial indicators more closely as a company's financial health over the long-term usually dictates market outcomes. In this article, we decided to focus on TCM Group's ROE.
Return on equity or ROE is an important factor to be considered by a shareholder because it tells them how effectively their capital is being reinvested. In other words, it is a profitability ratio which measures the rate of return on the capital provided by the company's shareholders.
Check out our latest analysis for TCM Group
How Is ROE Calculated?
The formula for return on equity is:
Return on Equity = Net Profit (from continuing operations) ÷ Shareholders' Equity
So, based on the above formula, the ROE for TCM Group is:
19% = kr.107m ÷ kr.550m (Based on the trailing twelve months to September 2020).
The 'return' is the income the business earned over the last year. One way to conceptualize this is that for each DKK1 of shareholders' capital it has, the company made DKK0.19 in profit.
What Is The Relationship Between ROE And Earnings Growth?
So far, we've learned that ROE is a measure of a company's profitability. Based on how much of its profits the company chooses to reinvest or "retain", we are then able to evaluate a company's future ability to generate profits. Generally speaking, other things being equal, firms with a high return on equity and profit retention, have a higher growth rate than firms that don’t share these attributes.
TCM Group's Earnings Growth And 19% ROE
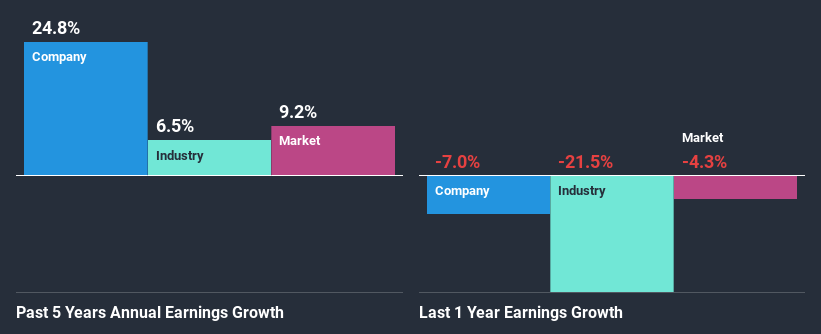
To start with, TCM Group's ROE looks acceptable. Especially when compared to the industry average of 8.3% the company's ROE looks pretty impressive. This certainly adds some context to TCM Group's exceptional 25% net income growth seen over the past five years. However, there could also be other causes behind this growth. For example, it is possible that the company's management has made some good strategic decisions, or that the company has a low payout ratio.
As a next step, we compared TCM Group's net income growth with the industry, and pleasingly, we found that the growth seen by the company is higher than the average industry growth of 7.2%.
Earnings growth is an important metric to consider when valuing a stock. The investor should try to establish if the expected growth or decline in earnings, whichever the case may be, is priced in. Doing so will help them establish if the stock's future looks promising or ominous. Is TCM fairly valued? This infographic on the company's intrinsic value has everything you need to know.
Is TCM Group Making Efficient Use Of Its Profits?
While the company did pay out a portion of its dividend in the past, it currently doesn't pay a dividend. This is likely what's driving the high earnings growth number discussed above.
Based on the latest analysts' estimates, we found that the company's future payout ratio over the next three years is expected to hold steady at 50%. Therefore, the company's future ROE is also not expected to change by much with analysts predicting an ROE of 22%.
Conclusion
On the whole, we feel that TCM Group's performance has been quite good. Particularly, we like that the company is reinvesting heavily into its business, and at a high rate of return. Unsurprisingly, this has led to an impressive earnings growth. Having said that, the company's earnings growth is expected to slow down, as forecasted in the current analyst estimates. Are these analysts expectations based on the broad expectations for the industry, or on the company's fundamentals? Click here to be taken to our analyst's forecasts page for the company.
If you decide to trade TCM Group, use the lowest-cost* platform that is rated #1 Overall by Barron’s, Interactive Brokers. Trade stocks, options, futures, forex, bonds and funds on 135 markets, all from a single integrated account. Promoted
If you're looking to trade TCM Group, open an account with the lowest-cost platform trusted by professionals, Interactive Brokers.
With clients in over 200 countries and territories, and access to 160 markets, IBKR lets you trade stocks, options, futures, forex, bonds and funds from a single integrated account.
Enjoy no hidden fees, no account minimums, and FX conversion rates as low as 0.03%, far better than what most brokers offer.
Sponsored ContentValuation is complex, but we're here to simplify it.
Discover if TCM Group might be undervalued or overvalued with our detailed analysis, featuring fair value estimates, potential risks, dividends, insider trades, and its financial condition.
Access Free AnalysisThis article by Simply Wall St is general in nature. It does not constitute a recommendation to buy or sell any stock, and does not take account of your objectives, or your financial situation. We aim to bring you long-term focused analysis driven by fundamental data. Note that our analysis may not factor in the latest price-sensitive company announcements or qualitative material. Simply Wall St has no position in any stocks mentioned.
*Interactive Brokers Rated Lowest Cost Broker by StockBrokers.com Annual Online Review 2020
Have feedback on this article? Concerned about the content? Get in touch with us directly. Alternatively, email editorial-team (at) simplywallst.com.
About CPSE:TCM
TCM Group
Manufactures and sells kitchen and furniture products for bathrooms and storage in Denmark, Norway, and internationally.
Reasonable growth potential with proven track record.
Market Insights

Community Narratives

