
Advertisement

Warren Buffett famously said, 'Volatility is far from synonymous with risk.' It's only natural to consider a company's balance sheet when you examine how risky it is, since debt is often involved when a business collapses. Importantly, ISS A/S (CPH:ISS) does carry debt. But the real question is whether this debt is making the company risky.
Why Does Debt Bring Risk?
Debt and other liabilities become risky for a business when it cannot easily fulfill those obligations, either with free cash flow or by raising capital at an attractive price. If things get really bad, the lenders can take control of the business. While that is not too common, we often do see indebted companies permanently diluting shareholders because lenders force them to raise capital at a distressed price. By replacing dilution, though, debt can be an extremely good tool for businesses that need capital to invest in growth at high rates of return. When we examine debt levels, we first consider both cash and debt levels, together.
View our latest analysis for ISS
How Much Debt Does ISS Carry?
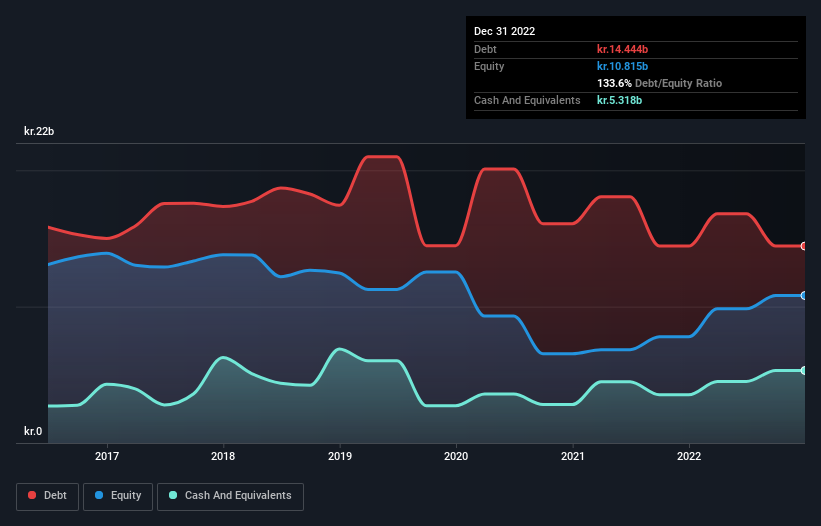
The chart below, which you can click on for greater detail, shows that ISS had kr.14.4b in debt in December 2022; about the same as the year before. However, it does have kr.5.32b in cash offsetting this, leading to net debt of about kr.9.13b.
How Healthy Is ISS' Balance Sheet?
The latest balance sheet data shows that ISS had liabilities of kr.17.4b due within a year, and liabilities of kr.18.8b falling due after that. Offsetting these obligations, it had cash of kr.5.32b as well as receivables valued at kr.12.2b due within 12 months. So its liabilities total kr.18.7b more than the combination of its cash and short-term receivables.
This deficit is considerable relative to its market capitalization of kr.26.1b, so it does suggest shareholders should keep an eye on ISS' use of debt. This suggests shareholders would be heavily diluted if the company needed to shore up its balance sheet in a hurry.
We measure a company's debt load relative to its earnings power by looking at its net debt divided by its earnings before interest, tax, depreciation, and amortization (EBITDA) and by calculating how easily its earnings before interest and tax (EBIT) cover its interest expense (interest cover). The advantage of this approach is that we take into account both the absolute quantum of debt (with net debt to EBITDA) and the actual interest expenses associated with that debt (with its interest cover ratio).
With net debt to EBITDA of 2.9 ISS has a fairly noticeable amount of debt. On the plus side, its EBIT was 7.8 times its interest expense, and its net debt to EBITDA, was quite high, at 2.9. Pleasingly, ISS is growing its EBIT faster than former Australian PM Bob Hawke downs a yard glass, boasting a 118% gain in the last twelve months. When analysing debt levels, the balance sheet is the obvious place to start. But ultimately the future profitability of the business will decide if ISS can strengthen its balance sheet over time. So if you're focused on the future you can check out this free report showing analyst profit forecasts.
But our final consideration is also important, because a company cannot pay debt with paper profits; it needs cold hard cash. So it's worth checking how much of that EBIT is backed by free cash flow. Over the last two years, ISS actually produced more free cash flow than EBIT. That sort of strong cash generation warms our hearts like a puppy in a bumblebee suit.
Our View
Happily, ISS's impressive conversion of EBIT to free cash flow implies it has the upper hand on its debt. But truth be told we feel its level of total liabilities does undermine this impression a bit. All these things considered, it appears that ISS can comfortably handle its current debt levels. Of course, while this leverage can enhance returns on equity, it does bring more risk, so it's worth keeping an eye on this one. The balance sheet is clearly the area to focus on when you are analysing debt. But ultimately, every company can contain risks that exist outside of the balance sheet. Case in point: We've spotted 2 warning signs for ISS you should be aware of.
When all is said and done, sometimes its easier to focus on companies that don't even need debt. Readers can access a list of growth stocks with zero net debt 100% free, right now.
New: AI Stock Screener & Alerts
Our new AI Stock Screener scans the market every day to uncover opportunities.
• Dividend Powerhouses (3%+ Yield)
• Undervalued Small Caps with Insider Buying
• High growth Tech and AI Companies
Or build your own from over 50 metrics.
Have feedback on this article? Concerned about the content? Get in touch with us directly. Alternatively, email editorial-team (at) simplywallst.com.
This article by Simply Wall St is general in nature. We provide commentary based on historical data and analyst forecasts only using an unbiased methodology and our articles are not intended to be financial advice. It does not constitute a recommendation to buy or sell any stock, and does not take account of your objectives, or your financial situation. We aim to bring you long-term focused analysis driven by fundamental data. Note that our analysis may not factor in the latest price-sensitive company announcements or qualitative material. Simply Wall St has no position in any stocks mentioned.
About CPSE:ISS
ISS
Operates as workplace experience and facility management company in the United Kingdom, Ireland, the United States, Canada, Switzerland, Germany, Australia, New Zealand, Türkiye, Spain, Denmark, and internationally.
Good value with proven track record.
Similar Companies
Market Insights

Advertisement
Community Narratives
WhiteCap Is Positioned To Profit Regardless Of Trump's Policy 
Fair Value CA$22.60|61.5% undervalued
ST
Equity Analyst and Writer
Microsoft's Evolution Will Drive Revenue to New Heights Fueled by AI
Fair Value US$360.00|30.7% overvalued
BR
Community Contributor
A CASE FOR USD$2.50 (CAD$3.44) BY 2028 (A 5-10 BAGGER)
Fair Value CA$3.44|88.1% undervalued
AG
Community Contributor