

David Iben put it well when he said, 'Volatility is not a risk we care about. What we care about is avoiding the permanent loss of capital.' So it seems the smart money knows that debt - which is usually involved in bankruptcies - is a very important factor, when you assess how risky a company is. We note that Solar A/S (CPH:SOLAR B) does have debt on its balance sheet. But the real question is whether this debt is making the company risky.
Why Does Debt Bring Risk?
Generally speaking, debt only becomes a real problem when a company can't easily pay it off, either by raising capital or with its own cash flow. In the worst case scenario, a company can go bankrupt if it cannot pay its creditors. While that is not too common, we often do see indebted companies permanently diluting shareholders because lenders force them to raise capital at a distressed price. Having said that, the most common situation is where a company manages its debt reasonably well - and to its own advantage. When we examine debt levels, we first consider both cash and debt levels, together.
Check out our latest analysis for Solar
What Is Solar's Net Debt?
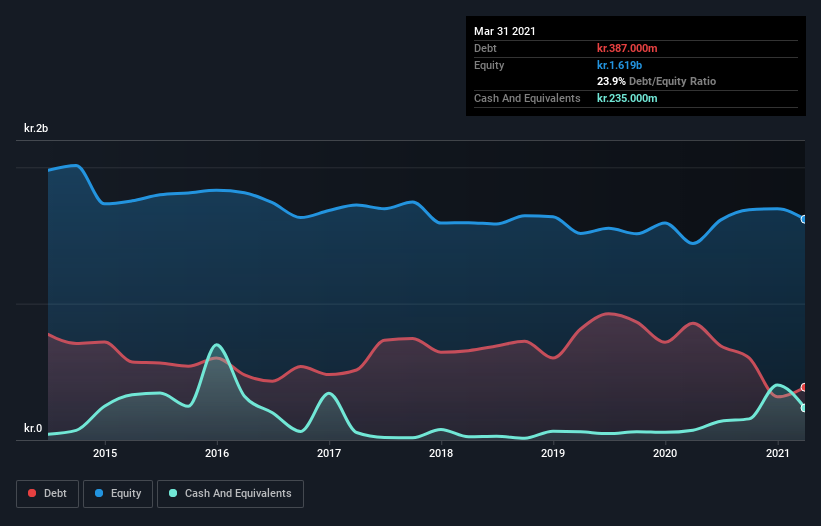
The image below, which you can click on for greater detail, shows that Solar had debt of kr.387.0m at the end of March 2021, a reduction from kr.857.0m over a year. On the flip side, it has kr.235.0m in cash leading to net debt of about kr.152.0m.
A Look At Solar's Liabilities
The latest balance sheet data shows that Solar had liabilities of kr.2.73b due within a year, and liabilities of kr.498.0m falling due after that. Offsetting these obligations, it had cash of kr.235.0m as well as receivables valued at kr.1.65b due within 12 months. So it has liabilities totalling kr.1.33b more than its cash and near-term receivables, combined.
This deficit isn't so bad because Solar is worth kr.4.10b, and thus could probably raise enough capital to shore up its balance sheet, if the need arose. However, it is still worthwhile taking a close look at its ability to pay off debt.
We use two main ratios to inform us about debt levels relative to earnings. The first is net debt divided by earnings before interest, tax, depreciation, and amortization (EBITDA), while the second is how many times its earnings before interest and tax (EBIT) covers its interest expense (or its interest cover, for short). Thus we consider debt relative to earnings both with and without depreciation and amortization expenses.
Solar has a low net debt to EBITDA ratio of only 0.30. And its EBIT easily covers its interest expense, being 18.4 times the size. So we're pretty relaxed about its super-conservative use of debt. On top of that, Solar grew its EBIT by 46% over the last twelve months, and that growth will make it easier to handle its debt. There's no doubt that we learn most about debt from the balance sheet. But ultimately the future profitability of the business will decide if Solar can strengthen its balance sheet over time. So if you're focused on the future you can check out this free report showing analyst profit forecasts.
Finally, a business needs free cash flow to pay off debt; accounting profits just don't cut it. So we always check how much of that EBIT is translated into free cash flow. During the last three years, Solar generated free cash flow amounting to a very robust 92% of its EBIT, more than we'd expect. That puts it in a very strong position to pay down debt.
Our View
The good news is that Solar's demonstrated ability to cover its interest expense with its EBIT delights us like a fluffy puppy does a toddler. And the good news does not stop there, as its conversion of EBIT to free cash flow also supports that impression! Considering this range of factors, it seems to us that Solar is quite prudent with its debt, and the risks seem well managed. So the balance sheet looks pretty healthy, to us. The balance sheet is clearly the area to focus on when you are analysing debt. However, not all investment risk resides within the balance sheet - far from it. For example, we've discovered 1 warning sign for Solar that you should be aware of before investing here.
Of course, if you're the type of investor who prefers buying stocks without the burden of debt, then don't hesitate to discover our exclusive list of net cash growth stocks, today.
When trading stocks or any other investment, use the platform considered by many to be the Professional's Gateway to the Worlds Market, Interactive Brokers. You get the lowest-cost* trading on stocks, options, futures, forex, bonds and funds worldwide from a single integrated account. Promoted
New: Manage All Your Stock Portfolios in One Place
We've created the ultimate portfolio companion for stock investors, and it's free.
• Connect an unlimited number of Portfolios and see your total in one currency
• Be alerted to new Warning Signs or Risks via email or mobile
• Track the Fair Value of your stocks
This article by Simply Wall St is general in nature. It does not constitute a recommendation to buy or sell any stock, and does not take account of your objectives, or your financial situation. We aim to bring you long-term focused analysis driven by fundamental data. Note that our analysis may not factor in the latest price-sensitive company announcements or qualitative material. Simply Wall St has no position in any stocks mentioned.
*Interactive Brokers Rated Lowest Cost Broker by StockBrokers.com Annual Online Review 2020
Have feedback on this article? Concerned about the content? Get in touch with us directly. Alternatively, email editorial-team (at) simplywallst.com.
About CPSE:SOLAR B
Solar
Operates as a sourcing and services company in electrical, heating and plumbing, ventilation, and climate and energy solutions in the Danish, Swedish, Norwegian, and Dutch markets.
Established dividend payer moderate.

