
Advertisement

Legendary fund manager Li Lu (who Charlie Munger backed) once said, 'The biggest investment risk is not the volatility of prices, but whether you will suffer a permanent loss of capital.' When we think about how risky a company is, we always like to look at its use of debt, since debt overload can lead to ruin. Importantly, Sixt SE (FRA:SIX2) does carry debt. But the more important question is: how much risk is that debt creating?
When Is Debt A Problem?
Debt is a tool to help businesses grow, but if a business is incapable of paying off its lenders, then it exists at their mercy. Ultimately, if the company can't fulfill its legal obligations to repay debt, shareholders could walk away with nothing. While that is not too common, we often do see indebted companies permanently diluting shareholders because lenders force them to raise capital at a distressed price. Of course, the upside of debt is that it often represents cheap capital, especially when it replaces dilution in a company with the ability to reinvest at high rates of return. When we think about a company's use of debt, we first look at cash and debt together.
See our latest analysis for Sixt
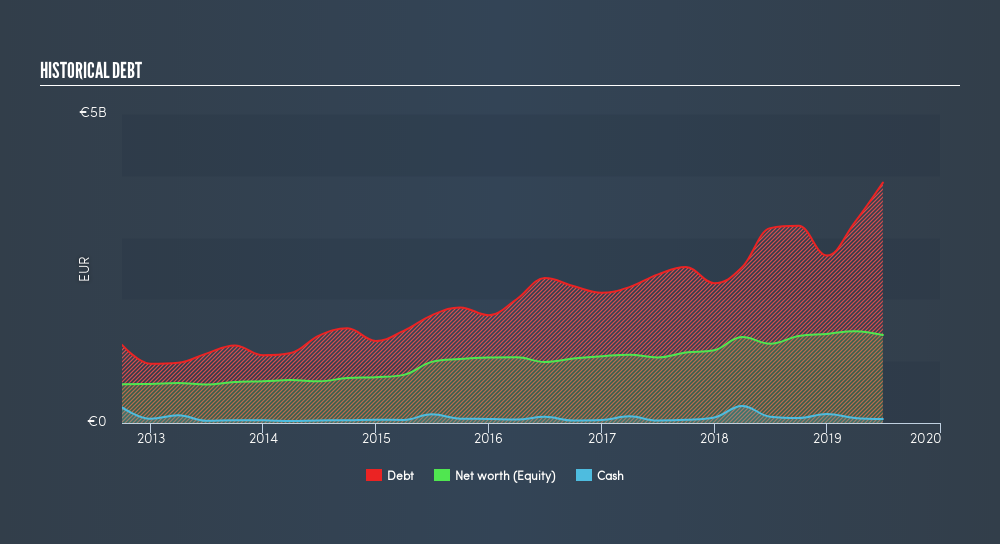
What Is Sixt's Net Debt?
As you can see below, at the end of June 2019, Sixt had €3.88b of debt, up from €3.15b a year ago. Click the image for more detail. Net debt is about the same, since the it doesn't have much cash.
How Strong Is Sixt's Balance Sheet?
Zooming in on the latest balance sheet data, we can see that Sixt had liabilities of €2.71b due within 12 months and liabilities of €2.61b due beyond that. Offsetting these obligations, it had cash of €62.9m as well as receivables valued at €1.11b due within 12 months. So its liabilities total €4.15b more than the combination of its cash and short-term receivables.
When you consider that this deficiency exceeds the company's €3.36b market capitalization, you might well be inclined to review the balance sheet, just like one might study a new partner's social media. In the scenario where the company had to clean up its balance sheet quickly, it seems likely shareholders would suffer extensive dilution.
We use two main ratios to inform us about debt levels relative to earnings. The first is net debt divided by earnings before interest, tax, depreciation, and amortization (EBITDA), while the second is how many times its earnings before interest and tax (EBIT) covers its interest expense (or its interest cover, for short). This way, we consider both the absolute quantum of the debt, as well as the interest rates paid on it.
As it happens Sixt has a fairly concerning net debt to EBITDA ratio of 8.6 but very strong interest coverage of 10.2. This means that unless the company has access to very cheap debt, that interest expense will likely grow in the future. We saw Sixt grow its EBIT by 5.0% in the last twelve months. Whilst that hardly knocks our socks off it is a positive when it comes to debt. The balance sheet is clearly the area to focus on when you are analysing debt. But it is future earnings, more than anything, that will determine Sixt's ability to maintain a healthy balance sheet going forward. So if you're focused on the future you can check out this free report showing analyst profit forecasts.
Finally, while the tax-man may adore accounting profits, lenders only accept cold hard cash. So it's worth checking how much of that EBIT is backed by free cash flow. Over the last three years, Sixt saw substantial negative free cash flow, in total. While investors are no doubt expecting a reversal of that situation in due course, it clearly does mean its use of debt is more risky.
Our View
To be frank both Sixt's net debt to EBITDA and its track record of converting EBIT to free cash flow make us rather uncomfortable with its debt levels. But at least it's pretty decent at covering its interest expense with its EBIT; that's encouraging. Overall, it seems to us that Sixt's balance sheet is really quite a risk to the business. So we're almost as wary of this stock as a hungry kitten is about falling into its owner's fish pond: once bitten, twice shy, as they say. Over time, share prices tend to follow earnings per share, so if you're interested in Sixt, you may well want to click here to check an interactive graph of its earnings per share history.
If, after all that, you're more interested in a fast growing company with a rock-solid balance sheet, then check out our list of net cash growth stocks without delay.
We aim to bring you long-term focused research analysis driven by fundamental data. Note that our analysis may not factor in the latest price-sensitive company announcements or qualitative material.
If you spot an error that warrants correction, please contact the editor at editorial-team@simplywallst.com. This article by Simply Wall St is general in nature. It does not constitute a recommendation to buy or sell any stock, and does not take account of your objectives, or your financial situation. Simply Wall St has no position in the stocks mentioned. Thank you for reading.
About DB:SIX2
Sixt
Through its subsidiaries, provides mobility services through corporate and franchise branch network for private and business customers.
Excellent balance sheet average dividend payer.
Similar Companies
Market Insights


Advertisement
Community Narratives
The Future of Drug Testing? Fingerprint Tech Shows Serious Promise
Fair Value US$2.98|40.3% undervalued
JO
Community Contributor
Suncorp’s Next Chapter: Insurance-Only and Ready to Grow
Fair Value AU$22.83|7.9% undervalued
RO
Community Contributor
Thyssenkrupp Nucera Will Achieve Double-Digit Profits by 2030 Boosted by Hydrogen Growth
Fair Value €14.40|31.3% undervalued
CH
Community Contributor
Tesla’s Nvidia Moment – The AI & Robotics Inflection Point
Fair Value US$359.72|12.3% undervalued
BL
Community Contributor