Investors Give niiio finance group AG (DUSE:NIII) Shares A 47% Hiding


The niiio finance group AG (DUSE:NIII) share price has fared very poorly over the last month, falling by a substantial 47%. Longer-term shareholders will rue the drop in the share price, since it's now virtually flat for the year after a promising few quarters.
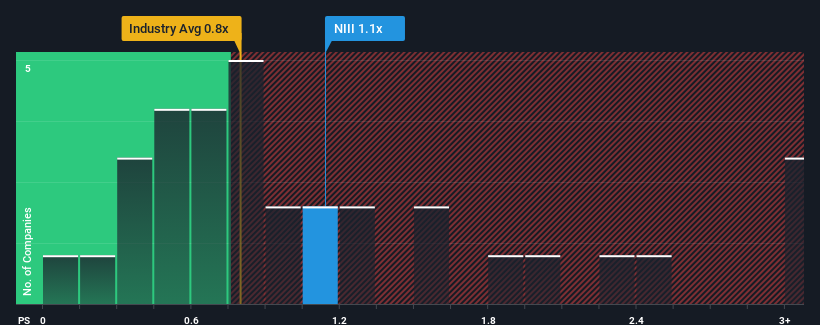
In spite of the heavy fall in price, you could still be forgiven for feeling indifferent about niiio finance group's P/S ratio of 1.1x, since the median price-to-sales (or "P/S") ratio for the IT industry in Germany is also close to 0.8x. Although, it's not wise to simply ignore the P/S without explanation as investors may be disregarding a distinct opportunity or a costly mistake.
Check out our latest analysis for niiio finance group
What Does niiio finance group's Recent Performance Look Like?
Revenue has risen firmly for niiio finance group recently, which is pleasing to see. One possibility is that the P/S is moderate because investors think this respectable revenue growth might not be enough to outperform the broader industry in the near future. If you like the company, you'd be hoping this isn't the case so that you could potentially pick up some stock while it's not quite in favour.
Although there are no analyst estimates available for niiio finance group, take a look at this free data-rich visualisation to see how the company stacks up on earnings, revenue and cash flow.Is There Some Revenue Growth Forecasted For niiio finance group?
In order to justify its P/S ratio, niiio finance group would need to produce growth that's similar to the industry.
If we review the last year of revenue growth, the company posted a worthy increase of 11%. Pleasingly, revenue has also lifted 256% in aggregate from three years ago, partly thanks to the last 12 months of growth. Accordingly, shareholders would have definitely welcomed those medium-term rates of revenue growth.
Comparing that recent medium-term revenue trajectory with the industry's one-year growth forecast of 11% shows it's noticeably more attractive.
With this information, we find it interesting that niiio finance group is trading at a fairly similar P/S compared to the industry. Apparently some shareholders believe the recent performance is at its limits and have been accepting lower selling prices.
The Key Takeaway
With its share price dropping off a cliff, the P/S for niiio finance group looks to be in line with the rest of the IT industry. Generally, our preference is to limit the use of the price-to-sales ratio to establishing what the market thinks about the overall health of a company.
To our surprise, niiio finance group revealed its three-year revenue trends aren't contributing to its P/S as much as we would have predicted, given they look better than current industry expectations. It'd be fair to assume that potential risks the company faces could be the contributing factor to the lower than expected P/S. While recent revenue trends over the past medium-term suggest that the risk of a price decline is low, investors appear to see the likelihood of revenue fluctuations in the future.
You should always think about risks. Case in point, we've spotted 4 warning signs for niiio finance group you should be aware of, and 2 of them shouldn't be ignored.
If companies with solid past earnings growth is up your alley, you may wish to see this free collection of other companies with strong earnings growth and low P/E ratios.
If you're looking to trade niiio finance group, open an account with the lowest-cost platform trusted by professionals, Interactive Brokers.
With clients in over 200 countries and territories, and access to 160 markets, IBKR lets you trade stocks, options, futures, forex, bonds and funds from a single integrated account.
Enjoy no hidden fees, no account minimums, and FX conversion rates as low as 0.03%, far better than what most brokers offer.
Sponsored ContentNew: Manage All Your Stock Portfolios in One Place
We've created the ultimate portfolio companion for stock investors, and it's free.
• Connect an unlimited number of Portfolios and see your total in one currency
• Be alerted to new Warning Signs or Risks via email or mobile
• Track the Fair Value of your stocks
Have feedback on this article? Concerned about the content? Get in touch with us directly. Alternatively, email editorial-team (at) simplywallst.com.
This article by Simply Wall St is general in nature. We provide commentary based on historical data and analyst forecasts only using an unbiased methodology and our articles are not intended to be financial advice. It does not constitute a recommendation to buy or sell any stock, and does not take account of your objectives, or your financial situation. We aim to bring you long-term focused analysis driven by fundamental data. Note that our analysis may not factor in the latest price-sensitive company announcements or qualitative material. Simply Wall St has no position in any stocks mentioned.
Have feedback on this article? Concerned about the content? Get in touch with us directly. Alternatively, email editorial-team@simplywallst.com
About DUSE:NIII
niiio finance group
Provides cloud-based software-as-a-service solutions for banks and financial service providers.
Low with imperfect balance sheet.
Market Insights

Community Narratives

