
Advertisement
If you're looking for a multi-bagger, there's a few things to keep an eye out for. One common approach is to try and find a company with returns on capital employed (ROCE) that are increasing, in conjunction with a growing amount of capital employed. Put simply, these types of businesses are compounding machines, meaning they are continually reinvesting their earnings at ever-higher rates of return. With that in mind, we've noticed some promising trends at Weng Fine Art (FRA:WFA) so let's look a bit deeper.
What is Return On Capital Employed (ROCE)?
If you haven't worked with ROCE before, it measures the 'return' (pre-tax profit) a company generates from capital employed in its business. The formula for this calculation on Weng Fine Art is:
Return on Capital Employed = Earnings Before Interest and Tax (EBIT) ÷ (Total Assets - Current Liabilities)
0.11 = €2.2m ÷ (€26m - €6.5m) (Based on the trailing twelve months to December 2019).
Therefore, Weng Fine Art has an ROCE of 11%. By itself that's a normal return on capital and it's in line with the industry's average returns of 11%.
See our latest analysis for Weng Fine Art
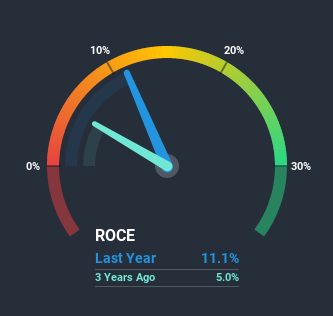
While the past is not representative of the future, it can be helpful to know how a company has performed historically, which is why we have this chart above. If you'd like to look at how Weng Fine Art has performed in the past in other metrics, you can view this free graph of past earnings, revenue and cash flow.
What Can We Tell From Weng Fine Art's ROCE Trend?
We like the trends that we're seeing from Weng Fine Art. The data shows that returns on capital have increased substantially over the last five years to 11%. Basically the business is earning more per dollar of capital invested and in addition to that, 46% more capital is being employed now too. So we're very much inspired by what we're seeing at Weng Fine Art thanks to its ability to profitably reinvest capital.
One more thing to note, Weng Fine Art has decreased current liabilities to 25% of total assets over this period, which effectively reduces the amount of funding from suppliers or short-term creditors. This tells us that Weng Fine Art has grown its returns without a reliance on increasing their current liabilities, which we're very happy with.
The Key Takeaway
To sum it up, Weng Fine Art has proven it can reinvest in the business and generate higher returns on that capital employed, which is terrific. And with the stock having performed exceptionally well over the last five years, these patterns are being accounted for by investors. With that being said, we still think the promising fundamentals mean the company deserves some further due diligence.
If you'd like to know more about Weng Fine Art, we've spotted 3 warning signs, and 2 of them make us uncomfortable.
While Weng Fine Art may not currently earn the highest returns, we've compiled a list of companies that currently earn more than 25% return on equity. Check out this free list here.
When trading Weng Fine Art or any other investment, use the platform considered by many to be the Professional's Gateway to the Worlds Market, Interactive Brokers. You get the lowest-cost* trading on stocks, options, futures, forex, bonds and funds worldwide from a single integrated account. Promoted
Valuation is complex, but we're here to simplify it.
Discover if Weng Fine Art might be undervalued or overvalued with our detailed analysis, featuring fair value estimates, potential risks, dividends, insider trades, and its financial condition.
Access Free AnalysisThis article by Simply Wall St is general in nature. It does not constitute a recommendation to buy or sell any stock, and does not take account of your objectives, or your financial situation. We aim to bring you long-term focused analysis driven by fundamental data. Note that our analysis may not factor in the latest price-sensitive company announcements or qualitative material. Simply Wall St has no position in any stocks mentioned.
*Interactive Brokers Rated Lowest Cost Broker by StockBrokers.com Annual Online Review 2020
Have feedback on this article? Concerned about the content? Get in touch with us directly. Alternatively, email editorial-team (at) simplywallst.com.
About DB:WFA
Weng Fine Art
Engages in the art trade business, focusing on the acquisition, sale, and distribution of artworks in Europe, the United States, Germany and internationally.
Mediocre balance sheet with low risk.
Market Insights

Advertisement
Community Narratives
The "Molecular Pencil": Why Beam's Technology is Built to Win
Fair Value US$65.01|65.4% undervalued
DA
Community Contributor
The silent giant behind virtually every advanced chip powering AI, smartphones, and modern infrastructure.
Fair Value US$310.00|6.1% undervalued
OS
Community Contributor
ADP Stock: Solid Fundamentals, But AI Investments Test Its Margin Resilience
Fair Value US$387.77|34.2% undervalued
YI
Community Contributor
MINISO's fair value is projected at 26.69 with an anticipated PE ratio shift of 20x
Fair Value US$24.03|9.6% undervalued
BE
Community Contributor