
Advertisement

Key Insights
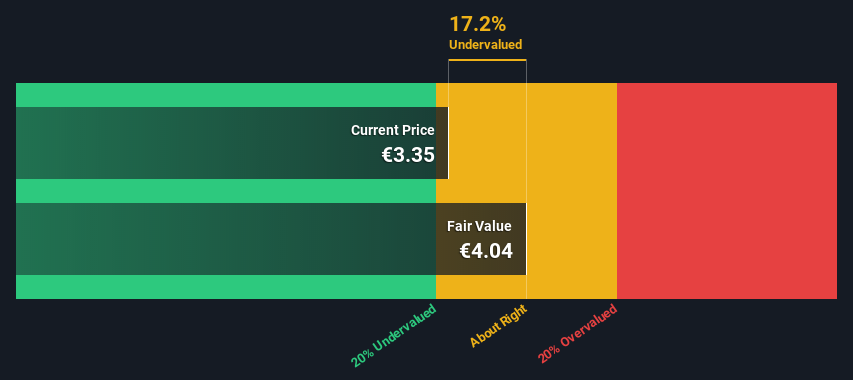
- Mister Spex's estimated fair value is €4.04 based on 2 Stage Free Cash Flow to Equity
- Mister Spex's €3.35 share price indicates it is trading at similar levels as its fair value estimate
- Analyst price target for MRX is €8.02, which is 98% above our fair value estimate
Today we will run through one way of estimating the intrinsic value of Mister Spex SE (FRA:MRX) by taking the expected future cash flows and discounting them to their present value. The Discounted Cash Flow (DCF) model is the tool we will apply to do this. There's really not all that much to it, even though it might appear quite complex.
We would caution that there are many ways of valuing a company and, like the DCF, each technique has advantages and disadvantages in certain scenarios. If you still have some burning questions about this type of valuation, take a look at the Simply Wall St analysis model.
See our latest analysis for Mister Spex
Crunching The Numbers
We are going to use a two-stage DCF model, which, as the name states, takes into account two stages of growth. The first stage is generally a higher growth period which levels off heading towards the terminal value, captured in the second 'steady growth' period. In the first stage we need to estimate the cash flows to the business over the next ten years. Where possible we use analyst estimates, but when these aren't available we extrapolate the previous free cash flow (FCF) from the last estimate or reported value. We assume companies with shrinking free cash flow will slow their rate of shrinkage, and that companies with growing free cash flow will see their growth rate slow, over this period. We do this to reflect that growth tends to slow more in the early years than it does in later years.
A DCF is all about the idea that a dollar in the future is less valuable than a dollar today, so we discount the value of these future cash flows to their estimated value in today's dollars:
10-year free cash flow (FCF) forecast
| 2023 | 2024 | 2025 | 2026 | 2027 | 2028 | 2029 | 2030 | 2031 | 2032 | |
| Levered FCF (€, Millions) | -€19.9m | -€15.9m | -€8.02m | €4.50m | €7.60m | €10.1m | €12.5m | €14.5m | €16.2m | €17.5m |
| Growth Rate Estimate Source | Analyst x5 | Analyst x4 | Analyst x4 | Analyst x1 | Analyst x1 | Est @ 33.09% | Est @ 23.24% | Est @ 16.34% | Est @ 11.51% | Est @ 8.13% |
| Present Value (€, Millions) Discounted @ 7.2% | -€18.6 | -€13.8 | -€6.5 | €3.4 | €5.4 | €6.7 | €7.7 | €8.3 | €8.7 | €8.8 |
("Est" = FCF growth rate estimated by Simply Wall St)
Present Value of 10-year Cash Flow (PVCF) = €10.0m
We now need to calculate the Terminal Value, which accounts for all the future cash flows after this ten year period. The Gordon Growth formula is used to calculate Terminal Value at a future annual growth rate equal to the 5-year average of the 10-year government bond yield of 0.2%. We discount the terminal cash flows to today's value at a cost of equity of 7.2%.
Terminal Value (TV)= FCF2032 × (1 + g) ÷ (r – g) = €17m× (1 + 0.2%) ÷ (7.2%– 0.2%) = €253m
Present Value of Terminal Value (PVTV)= TV / (1 + r)10= €253m÷ ( 1 + 7.2%)10= €127m
The total value, or equity value, is then the sum of the present value of the future cash flows, which in this case is €137m. In the final step we divide the equity value by the number of shares outstanding. Relative to the current share price of €3.4, the company appears about fair value at a 17% discount to where the stock price trades currently. Remember though, that this is just an approximate valuation, and like any complex formula - garbage in, garbage out.
Important Assumptions
Now the most important inputs to a discounted cash flow are the discount rate, and of course, the actual cash flows. If you don't agree with these result, have a go at the calculation yourself and play with the assumptions. The DCF also does not consider the possible cyclicality of an industry, or a company's future capital requirements, so it does not give a full picture of a company's potential performance. Given that we are looking at Mister Spex as potential shareholders, the cost of equity is used as the discount rate, rather than the cost of capital (or weighted average cost of capital, WACC) which accounts for debt. In this calculation we've used 7.2%, which is based on a levered beta of 1.164. Beta is a measure of a stock's volatility, compared to the market as a whole. We get our beta from the industry average beta of globally comparable companies, with an imposed limit between 0.8 and 2.0, which is a reasonable range for a stable business.
SWOT Analysis for Mister Spex
Strength
- Debt is well covered by earnings.
Weakness
- Shareholders have been diluted in the past year.
Opportunity
- Forecast to reduce losses next year.
- Has sufficient cash runway for more than 3 years based on current free cash flows.
- Current share price is below our estimate of fair value.
Threat
- Debt is not well covered by operating cash flow.
- Not expected to become profitable over the next 3 years.
Looking Ahead:
Valuation is only one side of the coin in terms of building your investment thesis, and it ideally won't be the sole piece of analysis you scrutinize for a company. DCF models are not the be-all and end-all of investment valuation. Preferably you'd apply different cases and assumptions and see how they would impact the company's valuation. For example, changes in the company's cost of equity or the risk free rate can significantly impact the valuation. For Mister Spex, we've compiled three pertinent aspects you should explore:
- Risks: For example, we've discovered 2 warning signs for Mister Spex that you should be aware of before investing here.
- Future Earnings: How does MRX's growth rate compare to its peers and the wider market? Dig deeper into the analyst consensus number for the upcoming years by interacting with our free analyst growth expectation chart.
- Other High Quality Alternatives: Do you like a good all-rounder? Explore our interactive list of high quality stocks to get an idea of what else is out there you may be missing!
PS. Simply Wall St updates its DCF calculation for every German stock every day, so if you want to find the intrinsic value of any other stock just search here.
New: Manage All Your Stock Portfolios in One Place
We've created the ultimate portfolio companion for stock investors, and it's free.
• Connect an unlimited number of Portfolios and see your total in one currency
• Be alerted to new Warning Signs or Risks via email or mobile
• Track the Fair Value of your stocks
Have feedback on this article? Concerned about the content? Get in touch with us directly. Alternatively, email editorial-team (at) simplywallst.com.
This article by Simply Wall St is general in nature. We provide commentary based on historical data and analyst forecasts only using an unbiased methodology and our articles are not intended to be financial advice. It does not constitute a recommendation to buy or sell any stock, and does not take account of your objectives, or your financial situation. We aim to bring you long-term focused analysis driven by fundamental data. Note that our analysis may not factor in the latest price-sensitive company announcements or qualitative material. Simply Wall St has no position in any stocks mentioned.
About DB:MRX
Mister Spex
Provides and markets eyewear products in Germany and internationally.
Excellent balance sheet and good value.
Similar Companies
Market Insights

Advertisement
Community Narratives

Apple: A Dying Star with an Overpriced Valuation
Fair Value US$177.34|18.9% overvalued
IN
Community Contributor
Avino a case for USD$20 per share within 5 years (assuming $3,500 gold, $100 silver and $4 copper).
Fair Value CA$26.79|87.5% undervalued
AG
Community Contributor
Riding the Defense Boom RENK Sees Revenue Climb at 15% CAGR by FY 2029
Fair Value €69.87|20.5% undervalued
CH
Community Contributor