- Germany
- /
- Specialty Stores
- /
- XTRA:WDL1
Here's Why We're Watching windeln.de's (ETR:WDL) Cash Burn Situation

We can readily understand why investors are attracted to unprofitable companies. For example, although Amazon.com made losses for many years after listing, if you had bought and held the shares since 1999, you would have made a fortune. But the harsh reality is that very many loss making companies burn through all their cash and go bankrupt.
So should windeln.de (ETR:WDL) shareholders be worried about its cash burn? In this report, we will consider the company's annual negative free cash flow, henceforth referring to it as the 'cash burn'. First, we'll determine its cash runway by comparing its cash burn with its cash reserves.
View our latest analysis for windeln.de
How Long Is windeln.de's Cash Runway?
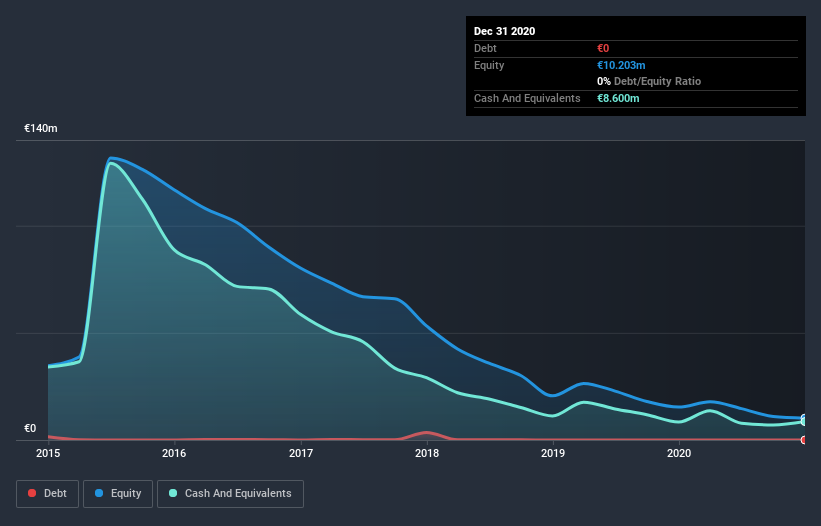
A company's cash runway is calculated by dividing its cash hoard by its cash burn. As at December 2020, windeln.de had cash of €8.6m and no debt. In the last year, its cash burn was €7.6m. So it had a cash runway of approximately 14 months from December 2020. Importantly, the one analyst we see covering the stock thinks that windeln.de will reach cashflow breakeven in 2 years. Essentially, that means the company will either reduce its cash burn, or else require more cash. You can see how its cash balance has changed over time in the image below.

How Well Is windeln.de Growing?
We reckon the fact that windeln.de managed to shrink its cash burn by 36% over the last year is rather encouraging. Revenue also improved during the period, increasing by 8.4%. On balance, we'd say the company is improving over time. Clearly, however, the crucial factor is whether the company will grow its business going forward. For that reason, it makes a lot of sense to take a look at our analyst forecasts for the company.
How Easily Can windeln.de Raise Cash?
windeln.de seems to be in a fairly good position, in terms of cash burn, but we still think it's worthwhile considering how easily it could raise more money if it wanted to. Companies can raise capital through either debt or equity. One of the main advantages held by publicly listed companies is that they can sell shares to investors to raise cash and fund growth. By comparing a company's annual cash burn to its total market capitalisation, we can estimate roughly how many shares it would have to issue in order to run the company for another year (at the same burn rate).
windeln.de has a market capitalisation of €18m and burnt through €7.6m last year, which is 42% of the company's market value. From this perspective, it seems that the company spent a huge amount relative to its market value, and we'd be very wary of a painful capital raising.
So, Should We Worry About windeln.de's Cash Burn?
Even though its cash burn relative to its market cap makes us a little nervous, we are compelled to mention that we thought windeln.de's cash burn reduction was relatively promising. Shareholders can take heart from the fact that at least one analyst is forecasting it will reach breakeven. Even though we don't think it has a problem with its cash burn, the analysis we've done in this article does suggest that shareholders should give some careful thought to the potential cost of raising more money in the future. An in-depth examination of risks revealed 2 warning signs for windeln.de that readers should think about before committing capital to this stock.
If you would prefer to check out another company with better fundamentals, then do not miss this free list of interesting companies, that have HIGH return on equity and low debt or this list of stocks which are all forecast to grow.
If you’re looking to trade windeln.de, open an account with the lowest-cost* platform trusted by professionals, Interactive Brokers. Their clients from over 200 countries and territories trade stocks, options, futures, forex, bonds and funds worldwide from a single integrated account. Promoted
Valuation is complex, but we're here to simplify it.
Discover if Nakiki might be undervalued or overvalued with our detailed analysis, featuring fair value estimates, potential risks, dividends, insider trades, and its financial condition.
Access Free AnalysisThis article by Simply Wall St is general in nature. It does not constitute a recommendation to buy or sell any stock, and does not take account of your objectives, or your financial situation. We aim to bring you long-term focused analysis driven by fundamental data. Note that our analysis may not factor in the latest price-sensitive company announcements or qualitative material. Simply Wall St has no position in any stocks mentioned.
*Interactive Brokers Rated Lowest Cost Broker by StockBrokers.com Annual Online Review 2020
Have feedback on this article? Concerned about the content? Get in touch with us directly. Alternatively, email editorial-team (at) simplywallst.com.
About XTRA:WDL1
Low with weak fundamentals.
Similar Companies
Market Insights
Community Narratives


