- Germany
- /
- Entertainment
- /
- DB:RTV
Estimating The Intrinsic Value Of Your Family Entertainment AG (FRA:RTV)


Key Insights
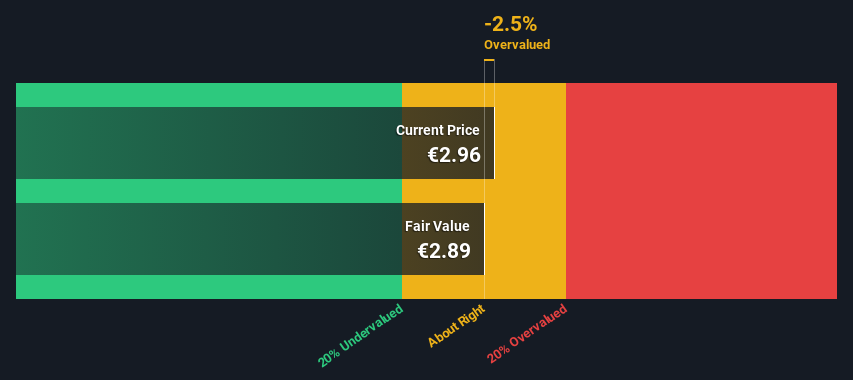
- Your Family Entertainment's estimated fair value is €2.89 based on 2 Stage Free Cash Flow to Equity
- Current share price of €2.96 suggests Your Family Entertainment is potentially trading close to its fair value
- Industry average of 51% suggests Your Family Entertainment's peers are currently trading at a higher premium to fair value
Does the February share price for Your Family Entertainment AG (FRA:RTV) reflect what it's really worth? Today, we will estimate the stock's intrinsic value by taking the expected future cash flows and discounting them to today's value. One way to achieve this is by employing the Discounted Cash Flow (DCF) model. It may sound complicated, but actually it is quite simple!
We would caution that there are many ways of valuing a company and, like the DCF, each technique has advantages and disadvantages in certain scenarios. If you want to learn more about discounted cash flow, the rationale behind this calculation can be read in detail in the Simply Wall St analysis model.
See our latest analysis for Your Family Entertainment
Step By Step Through The Calculation
We're using the 2-stage growth model, which simply means we take in account two stages of company's growth. In the initial period the company may have a higher growth rate and the second stage is usually assumed to have a stable growth rate. To begin with, we have to get estimates of the next ten years of cash flows. Where possible we use analyst estimates, but when these aren't available we extrapolate the previous free cash flow (FCF) from the last estimate or reported value. We assume companies with shrinking free cash flow will slow their rate of shrinkage, and that companies with growing free cash flow will see their growth rate slow, over this period. We do this to reflect that growth tends to slow more in the early years than it does in later years.
A DCF is all about the idea that a dollar in the future is less valuable than a dollar today, and so the sum of these future cash flows is then discounted to today's value:
10-year free cash flow (FCF) estimate
| 2024 | 2025 | 2026 | 2027 | 2028 | 2029 | 2030 | 2031 | 2032 | 2033 | |
| Levered FCF (€, Millions) | €590.0k | €980.0k | €1.30m | €1.59m | €1.84m | €2.05m | €2.22m | €2.35m | €2.45m | €2.53m |
| Growth Rate Estimate Source | Analyst x1 | Analyst x1 | Est @ 32.18% | Est @ 22.70% | Est @ 16.05% | Est @ 11.41% | Est @ 8.15% | Est @ 5.87% | Est @ 4.28% | Est @ 3.16% |
| Present Value (€, Millions) Discounted @ 5.4% | €0.6 | €0.9 | €1.1 | €1.3 | €1.4 | €1.5 | €1.5 | €1.5 | €1.5 | €1.5 |
("Est" = FCF growth rate estimated by Simply Wall St)
Present Value of 10-year Cash Flow (PVCF) = €13m
After calculating the present value of future cash flows in the initial 10-year period, we need to calculate the Terminal Value, which accounts for all future cash flows beyond the first stage. For a number of reasons a very conservative growth rate is used that cannot exceed that of a country's GDP growth. In this case we have used the 5-year average of the 10-year government bond yield (0.6%) to estimate future growth. In the same way as with the 10-year 'growth' period, we discount future cash flows to today's value, using a cost of equity of 5.4%.
Terminal Value (TV)= FCF2033 × (1 + g) ÷ (r – g) = €2.5m× (1 + 0.6%) ÷ (5.4%– 0.6%) = €53m
Present Value of Terminal Value (PVTV)= TV / (1 + r)10= €53m÷ ( 1 + 5.4%)10= €31m
The total value is the sum of cash flows for the next ten years plus the discounted terminal value, which results in the Total Equity Value, which in this case is €44m. The last step is to then divide the equity value by the number of shares outstanding. Compared to the current share price of €3.0, the company appears around fair value at the time of writing. Remember though, that this is just an approximate valuation, and like any complex formula - garbage in, garbage out.
Important Assumptions
The calculation above is very dependent on two assumptions. The first is the discount rate and the other is the cash flows. If you don't agree with these result, have a go at the calculation yourself and play with the assumptions. The DCF also does not consider the possible cyclicality of an industry, or a company's future capital requirements, so it does not give a full picture of a company's potential performance. Given that we are looking at Your Family Entertainment as potential shareholders, the cost of equity is used as the discount rate, rather than the cost of capital (or weighted average cost of capital, WACC) which accounts for debt. In this calculation we've used 5.4%, which is based on a levered beta of 1.046. Beta is a measure of a stock's volatility, compared to the market as a whole. We get our beta from the industry average beta of globally comparable companies, with an imposed limit between 0.8 and 2.0, which is a reasonable range for a stable business.
SWOT Analysis for Your Family Entertainment
- Earnings growth over the past year exceeded the industry.
- Debt is well covered by earnings.
- Expensive based on P/E ratio and estimated fair value.
- Annual revenue is forecast to grow faster than the German market.
- Debt is not well covered by operating cash flow.
Next Steps:
Valuation is only one side of the coin in terms of building your investment thesis, and it shouldn't be the only metric you look at when researching a company. The DCF model is not a perfect stock valuation tool. Rather it should be seen as a guide to "what assumptions need to be true for this stock to be under/overvalued?" For example, changes in the company's cost of equity or the risk free rate can significantly impact the valuation. For Your Family Entertainment, we've put together three fundamental factors you should assess:
- Risks: As an example, we've found 5 warning signs for Your Family Entertainment (1 is concerning!) that you need to consider before investing here.
- Future Earnings: How does RTV's growth rate compare to its peers and the wider market? Dig deeper into the analyst consensus number for the upcoming years by interacting with our free analyst growth expectation chart.
- Other Solid Businesses: Low debt, high returns on equity and good past performance are fundamental to a strong business. Why not explore our interactive list of stocks with solid business fundamentals to see if there are other companies you may not have considered!
PS. The Simply Wall St app conducts a discounted cash flow valuation for every stock on the DB every day. If you want to find the calculation for other stocks just search here.
If you're looking to trade Your Family Entertainment, open an account with the lowest-cost platform trusted by professionals, Interactive Brokers.
With clients in over 200 countries and territories, and access to 160 markets, IBKR lets you trade stocks, options, futures, forex, bonds and funds from a single integrated account.
Enjoy no hidden fees, no account minimums, and FX conversion rates as low as 0.03%, far better than what most brokers offer.
Sponsored ContentNew: Manage All Your Stock Portfolios in One Place
We've created the ultimate portfolio companion for stock investors, and it's free.
• Connect an unlimited number of Portfolios and see your total in one currency
• Be alerted to new Warning Signs or Risks via email or mobile
• Track the Fair Value of your stocks
Have feedback on this article? Concerned about the content? Get in touch with us directly. Alternatively, email editorial-team (at) simplywallst.com.
This article by Simply Wall St is general in nature. We provide commentary based on historical data and analyst forecasts only using an unbiased methodology and our articles are not intended to be financial advice. It does not constitute a recommendation to buy or sell any stock, and does not take account of your objectives, or your financial situation. We aim to bring you long-term focused analysis driven by fundamental data. Note that our analysis may not factor in the latest price-sensitive company announcements or qualitative material. Simply Wall St has no position in any stocks mentioned.
About DB:RTV
Your Family Entertainment
Operates as a producer and license distributor of family and children entertainment programs worldwide.
Reasonable growth potential with adequate balance sheet.
Similar Companies
Market Insights

Community Narratives

