
Advertisement
K+S Aktiengesellschaft's (ETR:SDF) Intrinsic Value Is Potentially 25% Below Its Share Price
Key Insights
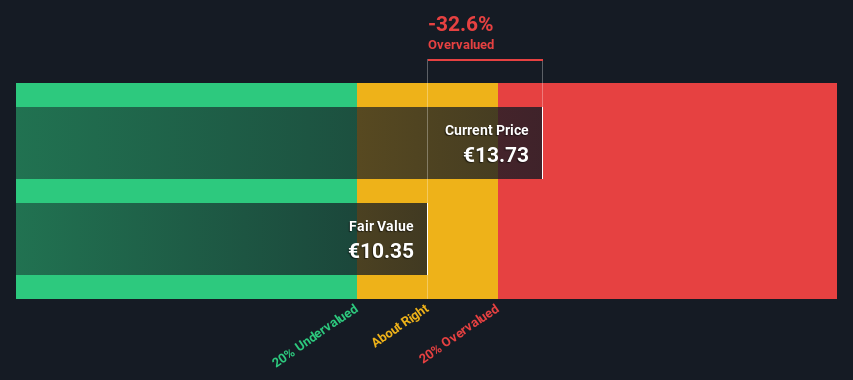
- K+S' estimated fair value is €10.35 based on 2 Stage Free Cash Flow to Equity
- Current share price of €13.73 suggests K+S is potentially 33% overvalued
- Our fair value estimate is 43% lower than K+S' analyst price target of €18.13
Today we will run through one way of estimating the intrinsic value of K+S Aktiengesellschaft (ETR:SDF) by taking the expected future cash flows and discounting them to their present value. The Discounted Cash Flow (DCF) model is the tool we will apply to do this. Before you think you won't be able to understand it, just read on! It's actually much less complex than you'd imagine.
Companies can be valued in a lot of ways, so we would point out that a DCF is not perfect for every situation. If you still have some burning questions about this type of valuation, take a look at the Simply Wall St analysis model.
Check out our latest analysis for K+S
The Calculation
We are going to use a two-stage DCF model, which, as the name states, takes into account two stages of growth. The first stage is generally a higher growth period which levels off heading towards the terminal value, captured in the second 'steady growth' period. To start off with, we need to estimate the next ten years of cash flows. Where possible we use analyst estimates, but when these aren't available we extrapolate the previous free cash flow (FCF) from the last estimate or reported value. We assume companies with shrinking free cash flow will slow their rate of shrinkage, and that companies with growing free cash flow will see their growth rate slow, over this period. We do this to reflect that growth tends to slow more in the early years than it does in later years.
A DCF is all about the idea that a dollar in the future is less valuable than a dollar today, so we discount the value of these future cash flows to their estimated value in today's dollars:
10-year free cash flow (FCF) estimate
| 2024 | 2025 | 2026 | 2027 | 2028 | 2029 | 2030 | 2031 | 2032 | 2033 | |
| Levered FCF (€, Millions) | €135.8m | €120.7m | €111.7m | €106.0m | €102.4m | €100.0m | €98.6m | €97.7m | €97.3m | €97.1m |
| Growth Rate Estimate Source | Analyst x6 | Analyst x3 | Est @ -7.47% | Est @ -5.09% | Est @ -3.42% | Est @ -2.26% | Est @ -1.44% | Est @ -0.87% | Est @ -0.47% | Est @ -0.19% |
| Present Value (€, Millions) Discounted @ 5.4% | €129 | €109 | €95.3 | €85.8 | €78.6 | €72.9 | €68.2 | €64.1 | €60.5 | €57.3 |
("Est" = FCF growth rate estimated by Simply Wall St)
Present Value of 10-year Cash Flow (PVCF) = €820m
After calculating the present value of future cash flows in the initial 10-year period, we need to calculate the Terminal Value, which accounts for all future cash flows beyond the first stage. For a number of reasons a very conservative growth rate is used that cannot exceed that of a country's GDP growth. In this case we have used the 5-year average of the 10-year government bond yield (0.5%) to estimate future growth. In the same way as with the 10-year 'growth' period, we discount future cash flows to today's value, using a cost of equity of 5.4%.
Terminal Value (TV)= FCF2033 × (1 + g) ÷ (r – g) = €97m× (1 + 0.5%) ÷ (5.4%– 0.5%) = €2.0b
Present Value of Terminal Value (PVTV)= TV / (1 + r)10= €2.0b÷ ( 1 + 5.4%)10= €1.2b
The total value, or equity value, is then the sum of the present value of the future cash flows, which in this case is €2.0b. To get the intrinsic value per share, we divide this by the total number of shares outstanding. Relative to the current share price of €13.7, the company appears potentially overvalued at the time of writing. Remember though, that this is just an approximate valuation, and like any complex formula - garbage in, garbage out.
Important Assumptions
Now the most important inputs to a discounted cash flow are the discount rate, and of course, the actual cash flows. You don't have to agree with these inputs, I recommend redoing the calculations yourself and playing with them. The DCF also does not consider the possible cyclicality of an industry, or a company's future capital requirements, so it does not give a full picture of a company's potential performance. Given that we are looking at K+S as potential shareholders, the cost of equity is used as the discount rate, rather than the cost of capital (or weighted average cost of capital, WACC) which accounts for debt. In this calculation we've used 5.4%, which is based on a levered beta of 0.991. Beta is a measure of a stock's volatility, compared to the market as a whole. We get our beta from the industry average beta of globally comparable companies, with an imposed limit between 0.8 and 2.0, which is a reasonable range for a stable business.
SWOT Analysis for K+S
Strength
- Debt is not viewed as a risk.
- Dividends are covered by earnings and cash flows.
- Dividend is in the top 25% of dividend payers in the market.
Weakness
- Earnings declined over the past year.
- Expensive based on P/E ratio and estimated fair value.
Opportunity
- SDF's financial characteristics indicate limited near-term opportunities for shareholders.
Threat
- Annual earnings are forecast to decline for the next 3 years.
Next Steps:
Although the valuation of a company is important, it shouldn't be the only metric you look at when researching a company. DCF models are not the be-all and end-all of investment valuation. Instead the best use for a DCF model is to test certain assumptions and theories to see if they would lead to the company being undervalued or overvalued. For instance, if the terminal value growth rate is adjusted slightly, it can dramatically alter the overall result. Why is the intrinsic value lower than the current share price? For K+S, we've put together three relevant elements you should further research:
- Risks: To that end, you should learn about the 3 warning signs we've spotted with K+S (including 1 which is concerning) .
- Future Earnings: How does SDF's growth rate compare to its peers and the wider market? Dig deeper into the analyst consensus number for the upcoming years by interacting with our free analyst growth expectation chart.
- Other High Quality Alternatives: Do you like a good all-rounder? Explore our interactive list of high quality stocks to get an idea of what else is out there you may be missing!
PS. Simply Wall St updates its DCF calculation for every German stock every day, so if you want to find the intrinsic value of any other stock just search here.
Valuation is complex, but we're here to simplify it.
Discover if K+S might be undervalued or overvalued with our detailed analysis, featuring fair value estimates, potential risks, dividends, insider trades, and its financial condition.
Access Free AnalysisHave feedback on this article? Concerned about the content? Get in touch with us directly. Alternatively, email editorial-team (at) simplywallst.com.
This article by Simply Wall St is general in nature. We provide commentary based on historical data and analyst forecasts only using an unbiased methodology and our articles are not intended to be financial advice. It does not constitute a recommendation to buy or sell any stock, and does not take account of your objectives, or your financial situation. We aim to bring you long-term focused analysis driven by fundamental data. Note that our analysis may not factor in the latest price-sensitive company announcements or qualitative material. Simply Wall St has no position in any stocks mentioned.
About XTRA:SDF
K+S
Operates as a supplier of mineral products for the agricultural, industrial, consumer, and community sectors in Europe, the United States, Asia, Africa, and Oceania.
Good value with adequate balance sheet.
Similar Companies
Market Insights

Advertisement
Community Narratives
Finding The True Value Of A Logistics Powerhouse
Fair Value US$95.21|7.5% undervalued
NV
Community Contributor
Paradigm Biopharmaceuticals Will Lead Osteoarthritis Treatment with Zilosul's FDA Success
Fair Value AU$5.50|91.8% undervalued
AM
Community Contributor
Barrick Mining (ABX:CA): A Gold Hedge against a U.S. Shutdown
Fair Value CA$60.00|26.4% undervalued
GM
Community Contributor