
Advertisement
- Germany
- /
- Metals and Mining
- /
- XTRA:NDA
Earnings grew faster than the notable 10% CAGR delivered to Aurubis (ETR:NDA) shareholders over the last five years
It hasn't been the best quarter for Aurubis AG (ETR:NDA) shareholders, since the share price has fallen 12% in that time. On the bright side the share price is up over the last half decade. Unfortunately its return of 44% is below the market return of 56%.
Since the long term performance has been good but there's been a recent pullback of 3.2%, let's check if the fundamentals match the share price.
See our latest analysis for Aurubis
To paraphrase Benjamin Graham: Over the short term the market is a voting machine, but over the long term it's a weighing machine. One way to examine how market sentiment has changed over time is to look at the interaction between a company's share price and its earnings per share (EPS).
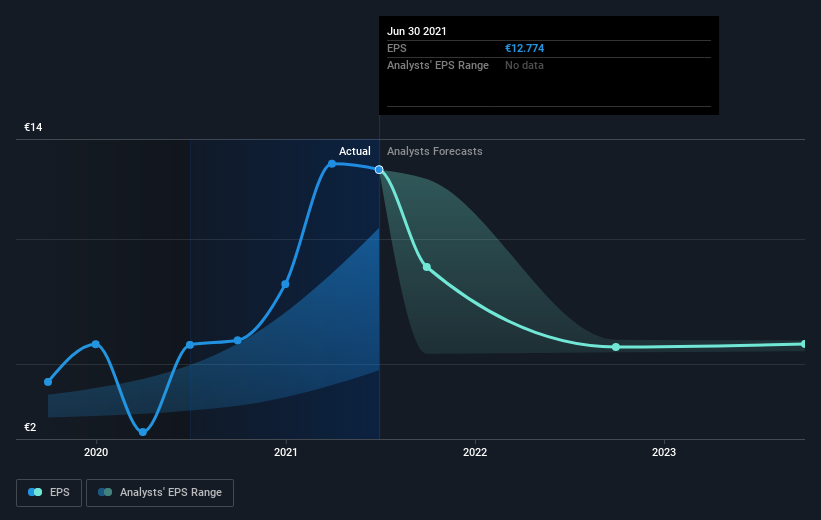
During five years of share price growth, Aurubis achieved compound earnings per share (EPS) growth of 91% per year. The EPS growth is more impressive than the yearly share price gain of 8% over the same period. So one could conclude that the broader market has become more cautious towards the stock. The reasonably low P/E ratio of 5.44 also suggests market apprehension.
The graphic below depicts how EPS has changed over time (unveil the exact values by clicking on the image).
We know that Aurubis has improved its bottom line lately, but is it going to grow revenue? This free report showing analyst revenue forecasts should help you figure out if the EPS growth can be sustained.
What About Dividends?
As well as measuring the share price return, investors should also consider the total shareholder return (TSR). Whereas the share price return only reflects the change in the share price, the TSR includes the value of dividends (assuming they were reinvested) and the benefit of any discounted capital raising or spin-off. Arguably, the TSR gives a more comprehensive picture of the return generated by a stock. In the case of Aurubis, it has a TSR of 63% for the last 5 years. That exceeds its share price return that we previously mentioned. This is largely a result of its dividend payments!
A Different Perspective
Aurubis shareholders are up 16% for the year (even including dividends). But that was short of the market average. The silver lining is that the gain was actually better than the average annual return of 10% per year over five year. It is possible that returns will improve along with the business fundamentals. I find it very interesting to look at share price over the long term as a proxy for business performance. But to truly gain insight, we need to consider other information, too. Take risks, for example - Aurubis has 2 warning signs (and 1 which is a bit unpleasant) we think you should know about.
If you are like me, then you will not want to miss this free list of growing companies that insiders are buying.
Please note, the market returns quoted in this article reflect the market weighted average returns of stocks that currently trade on DE exchanges.
If you decide to trade Aurubis, use the lowest-cost* platform that is rated #1 Overall by Barron’s, Interactive Brokers. Trade stocks, options, futures, forex, bonds and funds on 135 markets, all from a single integrated account. Promoted
New: Manage All Your Stock Portfolios in One Place
We've created the ultimate portfolio companion for stock investors, and it's free.
• Connect an unlimited number of Portfolios and see your total in one currency
• Be alerted to new Warning Signs or Risks via email or mobile
• Track the Fair Value of your stocks
This article by Simply Wall St is general in nature. We provide commentary based on historical data and analyst forecasts only using an unbiased methodology and our articles are not intended to be financial advice. It does not constitute a recommendation to buy or sell any stock, and does not take account of your objectives, or your financial situation. We aim to bring you long-term focused analysis driven by fundamental data. Note that our analysis may not factor in the latest price-sensitive company announcements or qualitative material. Simply Wall St has no position in any stocks mentioned.
*Interactive Brokers Rated Lowest Cost Broker by StockBrokers.com Annual Online Review 2020
Have feedback on this article? Concerned about the content? Get in touch with us directly. Alternatively, email editorial-team (at) simplywallst.com.
About XTRA:NDA
Flawless balance sheet and undervalued.
Similar Companies
Market Insights

Advertisement
Community Narratives
Finding The True Value Of A Logistics Powerhouse
Fair Value US$95.21|8.5% undervalued
NV
Community Contributor
Paradigm Biopharmaceuticals Will Lead Osteoarthritis Treatment with Zilosul's FDA Success
Fair Value AU$5.50|91.9% undervalued
AM
Community Contributor
Barrick Mining (ABX:CA): A Gold Hedge against a U.S. Shutdown
Fair Value CA$60.00|26.5% undervalued
GM
Community Contributor