
Advertisement
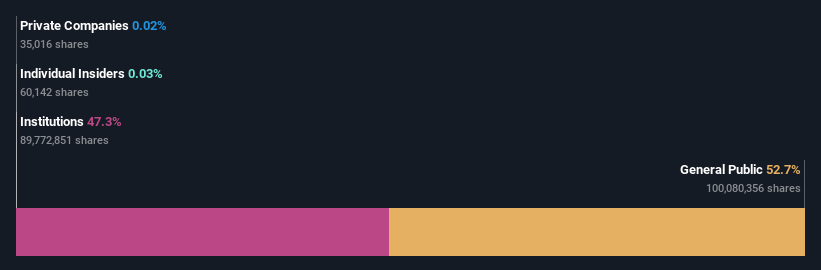
Covestro AG's (ETR:1COV) largest shareholders are individual investors with 53% ownership, institutions own 47%

Key Insights
- Significant control over Covestro by individual investors implies that the general public has more power to influence management and governance-related decisions
- 40% of the business is held by the top 25 shareholders
- Institutional ownership in Covestro is 47%
Every investor in Covestro AG (ETR:1COV) should be aware of the most powerful shareholder groups. With 53% stake, individual investors possess the maximum shares in the company. In other words, the group stands to gain the most (or lose the most) from their investment into the company.
And institutions on the other hand have a 47% ownership in the company. Institutions will often hold stock in bigger companies, and we expect to see insiders owning a noticeable percentage of the smaller ones.
Let's take a closer look to see what the different types of shareholders can tell us about Covestro.
View our latest analysis for Covestro
What Does The Institutional Ownership Tell Us About Covestro?
Many institutions measure their performance against an index that approximates the local market. So they usually pay more attention to companies that are included in major indices.
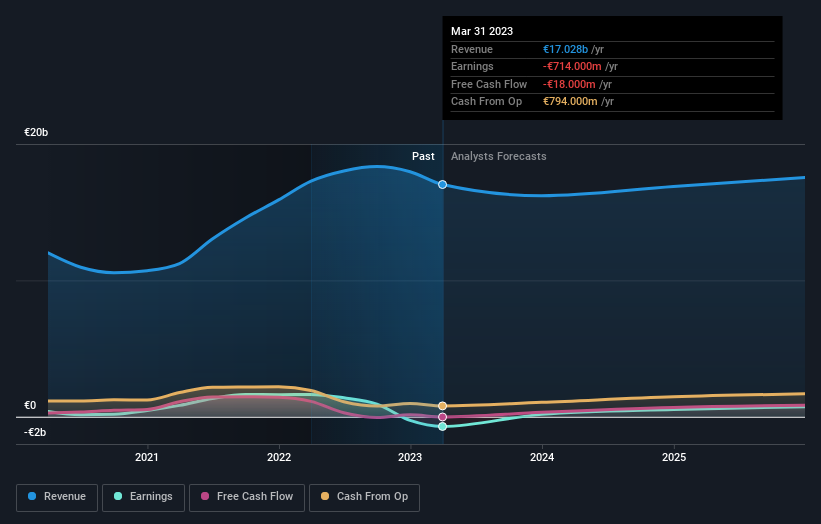
We can see that Covestro does have institutional investors; and they hold a good portion of the company's stock. This implies the analysts working for those institutions have looked at the stock and they like it. But just like anyone else, they could be wrong. It is not uncommon to see a big share price drop if two large institutional investors try to sell out of a stock at the same time. So it is worth checking the past earnings trajectory of Covestro, (below). Of course, keep in mind that there are other factors to consider, too.
Covestro is not owned by hedge funds. Our data shows that BlackRock, Inc. is the largest shareholder with 6.1% of shares outstanding. Meanwhile, the second and third largest shareholders, hold 3.6% and 3.4%, of the shares outstanding, respectively.
A deeper look at our ownership data shows that the top 25 shareholders collectively hold less than half of the register, suggesting a large group of small holders where no single shareholder has a majority.
While it makes sense to study institutional ownership data for a company, it also makes sense to study analyst sentiments to know which way the wind is blowing. There are plenty of analysts covering the stock, so it might be worth seeing what they are forecasting, too.
Insider Ownership Of Covestro
The definition of company insiders can be subjective and does vary between jurisdictions. Our data reflects individual insiders, capturing board members at the very least. The company management answer to the board and the latter should represent the interests of shareholders. Notably, sometimes top-level managers are on the board themselves.
I generally consider insider ownership to be a good thing. However, on some occasions it makes it more difficult for other shareholders to hold the board accountable for decisions.
Our information suggests that Covestro AG insiders own under 1% of the company. It is a pretty big company, so it would be possible for board members to own a meaningful interest in the company, without owning much of a proportional interest. In this case, they own around €2.3m worth of shares (at current prices). It is always good to see at least some insider ownership, but it might be worth checking if those insiders have been selling.
General Public Ownership
The general public -- including retail investors -- own 53% of Covestro. With this amount of ownership, retail investors can collectively play a role in decisions that affect shareholder returns, such as dividend policies and the appointment of directors. They can also exercise the power to vote on acquisitions or mergers that may not improve profitability.
Next Steps:
I find it very interesting to look at who exactly owns a company. But to truly gain insight, we need to consider other information, too.
I always like to check for a history of revenue growth. You can too, by accessing this free chart of historic revenue and earnings in this detailed graph.
If you are like me, you may want to think about whether this company will grow or shrink. Luckily, you can check this free report showing analyst forecasts for its future.
NB: Figures in this article are calculated using data from the last twelve months, which refer to the 12-month period ending on the last date of the month the financial statement is dated. This may not be consistent with full year annual report figures.
New: AI Stock Screener & Alerts
Our new AI Stock Screener scans the market every day to uncover opportunities.
• Dividend Powerhouses (3%+ Yield)
• Undervalued Small Caps with Insider Buying
• High growth Tech and AI Companies
Or build your own from over 50 metrics.
Have feedback on this article? Concerned about the content? Get in touch with us directly. Alternatively, email editorial-team (at) simplywallst.com.
This article by Simply Wall St is general in nature. We provide commentary based on historical data and analyst forecasts only using an unbiased methodology and our articles are not intended to be financial advice. It does not constitute a recommendation to buy or sell any stock, and does not take account of your objectives, or your financial situation. We aim to bring you long-term focused analysis driven by fundamental data. Note that our analysis may not factor in the latest price-sensitive company announcements or qualitative material. Simply Wall St has no position in any stocks mentioned.
About XTRA:1COV
Good value with adequate balance sheet.
Similar Companies
Market Insights

Advertisement
Community Narratives
Groundbreaking therapies that could change the treatment landscape for PTSD, fibromyalgia, MS & Alzheimer’s
Fair Value US$6.20|86.9% undervalued
CM
Community Contributor
DigitalOcean Will Grow 14% by Embracing AI with Paperspace Acquisition
Fair Value US$50.00|41.7% undervalued
NE
Community Contributor
Viant Technology: A Rising AdTech Challenger in the AI-Powered CTV Market
Fair Value US$38.61|63.2% undervalued
BL
Community Contributor
Volvo will Accelerate Forward into Electric and Autonomous Leadership in Five Years
Fair Value SEK 438.80|39.7% undervalued
UN
Community Contributor