
Advertisement
Does Talanx AG's (ETR:TLX) 11% Earnings Growth Make It An Outperformer?

Assessing Talanx AG's (ETR:TLX) past track record of performance is an insightful exercise for investors. It allows us to reflect on whether or not the company has met or exceed expectations, which is a great indicator for future performance. Today I will assess TLX's recent performance announced on 31 March 2019 and evaluate these figures to its long-term trend and industry movements.
Want to participate in a short research study? Help shape the future of investing tools and you could win a $250 gift card!
See our latest analysis for Talanx
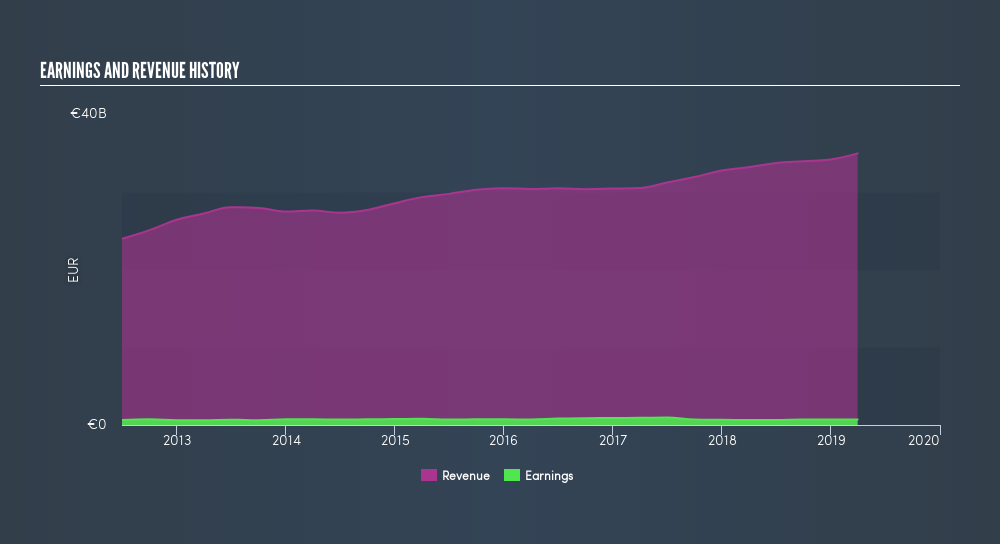
Commentary On TLX's Past Performance
TLX's trailing twelve-month earnings (from 31 March 2019) of €720m has jumped 11% compared to the previous year.
Furthermore, this one-year growth rate has exceeded its 5-year annual growth average of -0.8%, indicating the rate at which TLX is growing has accelerated. What's enabled this growth? Let's see whether it is merely due to an industry uplift, or if Talanx has experienced some company-specific growth.
In terms of returns from investment, Talanx has fallen short of achieving a 20% return on equity (ROE), recording 8.8% instead. Furthermore, its return on assets (ROA) of 0.6% is below the DE Insurance industry of 0.9%, indicating Talanx's are utilized less efficiently. And finally, its return on capital (ROC), which also accounts for Talanx’s debt level, has declined over the past 3 years from 1.7% to 1.3%. This correlates with an increase in debt holding, with debt-to-equity ratio rising from 28% to 32% over the past 5 years.
What does this mean?
While past data is useful, it doesn’t tell the whole story. Recent positive growth doesn’t necessarily mean it’s onwards and upwards for the company. There may be variables that are affecting the entire industry thus the high industry growth rate over the same time period. I recommend you continue to research Talanx to get a better picture of the stock by looking at:
- Future Outlook: What are well-informed industry analysts predicting for TLX’s future growth? Take a look at our free research report of analyst consensus for TLX’s outlook.
- Financial Health: Are TLX’s operations financially sustainable? Balance sheets can be hard to analyze, which is why we’ve done it for you. Check out our financial health checks here.
- Other High-Performing Stocks: Are there other stocks that provide better prospects with proven track records? Explore our free list of these great stocks here.
NB: Figures in this article are calculated using data from the trailing twelve months from 31 March 2019. This may not be consistent with full year annual report figures.
We aim to bring you long-term focused research analysis driven by fundamental data. Note that our analysis may not factor in the latest price-sensitive company announcements or qualitative material.
If you spot an error that warrants correction, please contact the editor at editorial-team@simplywallst.com. This article by Simply Wall St is general in nature. It does not constitute a recommendation to buy or sell any stock, and does not take account of your objectives, or your financial situation. Simply Wall St has no position in the stocks mentioned. Thank you for reading.
About XTRA:TLX
Talanx
Provides insurance and reinsurance products and services worldwide.
Excellent balance sheet established dividend payer.
Similar Companies
Market Insights


Advertisement
Community Narratives
For the Emperor: Why Games Workshop Could Be a Star Investment
Fair Value UK£160.00|0.4% overvalued
RO
Community Contributor
Securitas will boost margins with AI and tech-driven services
Fair Value SEK 260.91|44.5% undervalued
UN
Community Contributor
A Leader in EV Charging with Growth Potential
Fair Value €27.00|17.8% undervalued
TI
Community Contributor