
Advertisement
- Germany
- /
- Healthcare Services
- /
- DB:FRE
How Good Is Fresenius SE & Co. KGaA (FRA:FRE), When It Comes To ROE?
One of the best investments we can make is in our own knowledge and skill set. With that in mind, this article will work through how we can use Return On Equity (ROE) to better understand a business. By way of learning-by-doing, we'll look at ROE to gain a better understanding of Fresenius SE & Co. KGaA (FRA:FRE).
Fresenius SE KGaA has a ROE of 12%, based on the last twelve months. That means that for every €1 worth of shareholders' equity, it generated €0.12 in profit.
See our latest analysis for Fresenius SE KGaA
How Do I Calculate ROE?
The formula for ROE is:
Return on Equity = Net Profit ÷ Shareholders' Equity
Or for Fresenius SE KGaA:
12% = €1.9b ÷ €25b (Based on the trailing twelve months to June 2019.)
It's easy to understand the 'net profit' part of that equation, but 'shareholders' equity' requires further explanation. It is the capital paid in by shareholders, plus any retained earnings. You can calculate shareholders' equity by subtracting the company's total liabilities from its total assets.
What Does Return On Equity Mean?
ROE looks at the amount a company earns relative to the money it has kept within the business. The 'return' is the amount earned after tax over the last twelve months. A higher profit will lead to a higher ROE. So, all else equal, investors should like a high ROE. That means it can be interesting to compare the ROE of different companies.
Does Fresenius SE KGaA Have A Good ROE?
By comparing a company's ROE with its industry average, we can get a quick measure of how good it is. The limitation of this approach is that some companies are quite different from others, even within the same industry classification. The image below shows that Fresenius SE KGaA has an ROE that is roughly in line with the Healthcare industry average (11%).
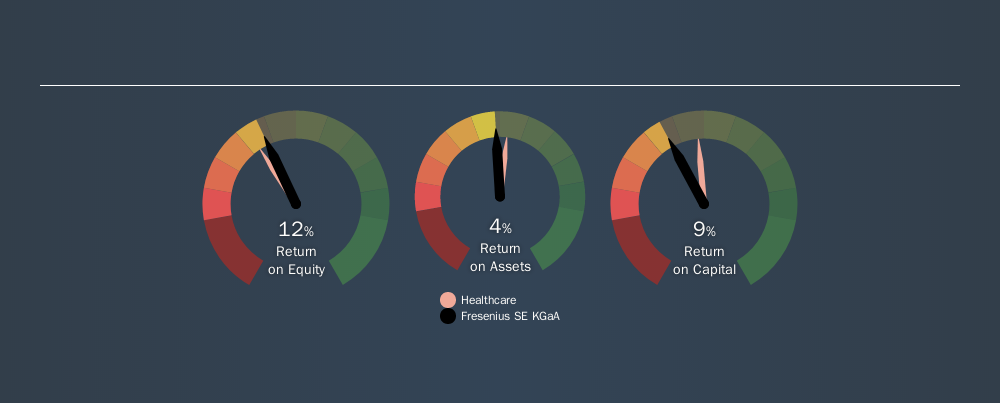
That isn't amazing, but it is respectable. ROE can give us a view about company quality, but many investors also look to other factors, such as whether there are insiders buying shares. I will like Fresenius SE KGaA better if I see some big insider buys. While we wait, check out this free list of growing companies with considerable, recent, insider buying.
How Does Debt Impact ROE?
Virtually all companies need money to invest in the business, to grow profits. The cash for investment can come from prior year profits (retained earnings), issuing new shares, or borrowing. In the first two cases, the ROE will capture this use of capital to grow. In the latter case, the use of debt will improve the returns, but will not change the equity. Thus the use of debt can improve ROE, albeit along with extra risk in the case of stormy weather, metaphorically speaking.
Fresenius SE KGaA's Debt And Its 12% ROE
Although Fresenius SE KGaA does use debt, its debt to equity ratio of 0.82 is still low. The fact that it achieved a fairly good ROE with only modest debt suggests the business might be worth putting on your watchlist. Careful use of debt to boost returns is often very good for shareholders. However, it could reduce the company's ability to take advantage of future opportunities.
The Key Takeaway
Return on equity is useful for comparing the quality of different businesses. A company that can achieve a high return on equity without debt could be considered a high quality business. All else being equal, a higher ROE is better.
But when a business is high quality, the market often bids it up to a price that reflects this. It is important to consider other factors, such as future profit growth -- and how much investment is required going forward. So you might want to check this FREE visualization of analyst forecasts for the company.
If you would prefer check out another company -- one with potentially superior financials -- then do not miss this free list of interesting companies, that have HIGH return on equity and low debt.
We aim to bring you long-term focused research analysis driven by fundamental data. Note that our analysis may not factor in the latest price-sensitive company announcements or qualitative material.
If you spot an error that warrants correction, please contact the editor at editorial-team@simplywallst.com. This article by Simply Wall St is general in nature. It does not constitute a recommendation to buy or sell any stock, and does not take account of your objectives, or your financial situation. Simply Wall St has no position in the stocks mentioned. Thank you for reading.
About DB:FRE
Fresenius SE KGaA
A health care company, provides products and services for chronically ill patients.
Average dividend payer and fair value.
Similar Companies
Market Insights

Advertisement
Community Narratives
Quality at a Premium. A time to watch, not to buy?
Fair Value US$154.56|29.9% undervalued
DA
Community Contributor
GRAB: The Super-App at the Heart of Southeast Asia’s Digital Boom
Fair Value US$8.20|22.9% undervalued
BL
Community Contributor
Verve Group to Surge with 51.61% Revenue Growth
Fair Value €6.00|64.1% undervalued
ME
Community Contributor