
Advertisement
- Germany
- /
- Hospitality
- /
- XTRA:ACX
bet-at-home.com (ETR:ACX) stock falls 11% in past week as five-year earnings and shareholder returns continue downward trend
Long term investing works well, but it doesn't always work for each individual stock. We really hate to see fellow investors lose their hard-earned money. Imagine if you held bet-at-home.com AG (ETR:ACX) for half a decade as the share price tanked 90%. And it's not just long term holders hurting, because the stock is down 71% in the last year. Shareholders have had an even rougher run lately, with the share price down 16% in the last 90 days. However, one could argue that the price has been influenced by the general market, which is down 14% in the same timeframe. While a drop like that is definitely a body blow, money isn't as important as health and happiness.
With the stock having lost 11% in the past week, it's worth taking a look at business performance and seeing if there's any red flags.
Check out our latest analysis for bet-at-home.com
To paraphrase Benjamin Graham: Over the short term the market is a voting machine, but over the long term it's a weighing machine. One way to examine how market sentiment has changed over time is to look at the interaction between a company's share price and its earnings per share (EPS).
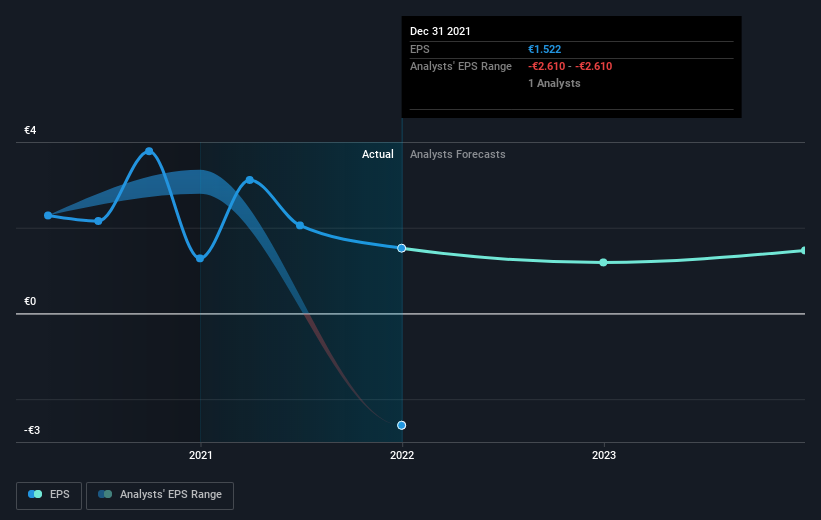
Looking back five years, both bet-at-home.com's share price and EPS declined; the latter at a rate of 19% per year. Readers should note that the share price has fallen faster than the EPS, at a rate of 37% per year, over the period. This implies that the market was previously too optimistic about the stock. The low P/E ratio of 8.72 further reflects this reticence.
You can see how EPS has changed over time in the image below (click on the chart to see the exact values).
We know that bet-at-home.com has improved its bottom line lately, but is it going to grow revenue? You could check out this free report showing analyst revenue forecasts.
What About Dividends?
When looking at investment returns, it is important to consider the difference between total shareholder return (TSR) and share price return. The TSR incorporates the value of any spin-offs or discounted capital raisings, along with any dividends, based on the assumption that the dividends are reinvested. It's fair to say that the TSR gives a more complete picture for stocks that pay a dividend. As it happens, bet-at-home.com's TSR for the last 5 years was -86%, which exceeds the share price return mentioned earlier. This is largely a result of its dividend payments!
A Different Perspective
We regret to report that bet-at-home.com shareholders are down 69% for the year (even including dividends). Unfortunately, that's worse than the broader market decline of 13%. Having said that, it's inevitable that some stocks will be oversold in a falling market. The key is to keep your eyes on the fundamental developments. Regrettably, last year's performance caps off a bad run, with the shareholders facing a total loss of 13% per year over five years. We realise that Baron Rothschild has said investors should "buy when there is blood on the streets", but we caution that investors should first be sure they are buying a high quality business. I find it very interesting to look at share price over the long term as a proxy for business performance. But to truly gain insight, we need to consider other information, too. For example, we've discovered 4 warning signs for bet-at-home.com (2 don't sit too well with us!) that you should be aware of before investing here.
If you like to buy stocks alongside management, then you might just love this free list of companies. (Hint: insiders have been buying them).
Please note, the market returns quoted in this article reflect the market weighted average returns of stocks that currently trade on DE exchanges.
New: Manage All Your Stock Portfolios in One Place
We've created the ultimate portfolio companion for stock investors, and it's free.
• Connect an unlimited number of Portfolios and see your total in one currency
• Be alerted to new Warning Signs or Risks via email or mobile
• Track the Fair Value of your stocks
Have feedback on this article? Concerned about the content? Get in touch with us directly. Alternatively, email editorial-team (at) simplywallst.com.
This article by Simply Wall St is general in nature. We provide commentary based on historical data and analyst forecasts only using an unbiased methodology and our articles are not intended to be financial advice. It does not constitute a recommendation to buy or sell any stock, and does not take account of your objectives, or your financial situation. We aim to bring you long-term focused analysis driven by fundamental data. Note that our analysis may not factor in the latest price-sensitive company announcements or qualitative material. Simply Wall St has no position in any stocks mentioned.
About XTRA:ACX
bet-at-home.com
Through its subsidiaries, provides online sports betting and online casino services in Germany, Austria, Eastern Europe, and rest of Western Europe.
Flawless balance sheet and good value.
Similar Companies
Market Insights

Advertisement
Community Narratives
The company that turned a verb into a global necessity and basically runs the modern internet, digital ads, smartphones, maps, and AI.
Fair Value US$300.00|8.5% undervalued
OS
Community Contributor
Flowers Foods Pays A Fair Price For Health
Fair Value US$16.12|24.6% undervalued
NV
Community Contributor
TMX Group will thrive with 33.3% profit margin and enduring market moat
Fair Value CA$49.90|0.1% undervalued
LI
Community Contributor