Advertisement
Should Investors Rethink PUMA Shares After This Month’s 9% Rally?

Simply Wall St
Reviewed by Bailey Pemberton
Wondering what to make of PUMA stock these days? If you’re caught between feeling the pain of last year’s slump and spotting hints of a rebound, you are certainly not alone. PUMA’s share price just wrapped up an encouraging 4.1% gain over the past week and is up a healthy 8.9% in the last month. These gains, while a breath of fresh air, follow a steep decline, with the stock still down 51.5% year-to-date and more than 40% off from last year. Even looking further out, the 3-year and 5-year performance shows prolonged headwinds, with declines of 52% and 70.4%, respectively. Recent price action suggests investors might be rethinking the level of risk in the stock, possibly positioning for a turnaround as market conditions evolve.
With a value score of 3 out of 6 based on standard checks, PUMA appears undervalued in half of the metrics considered. Does this really signal an opportunity, or are there hidden risks lurking behind those numbers? To help you decide whether PUMA deserves a spot in your portfolio, let’s walk through the main approaches analysts use to gauge if a stock is truly undervalued. There is an even more insightful angle waiting at the end of this article.
Why PUMA is lagging behind its peers
Approach 1: PUMA Discounted Cash Flow (DCF) Analysis
A Discounted Cash Flow (DCF) model estimates a company's intrinsic value by predicting its future cash flows and discounting them back to their present value. This approach gives investors a sense of what a stock could be worth based on the business’s long-term earning power, rather than its current market mood.
Looking at PUMA, the DCF analysis uses a 2 Stage Free Cash Flow to Equity model. Currently, the company’s last twelve months’ free cash flow stands at -€9.1 million, indicating negative cash flow over the recent period. However, analysts project a strong turnaround with free cash flow expected to rise steadily over the coming years, reaching €204.5 million by 2035, based on a mix of analyst estimates and extended forecasts.
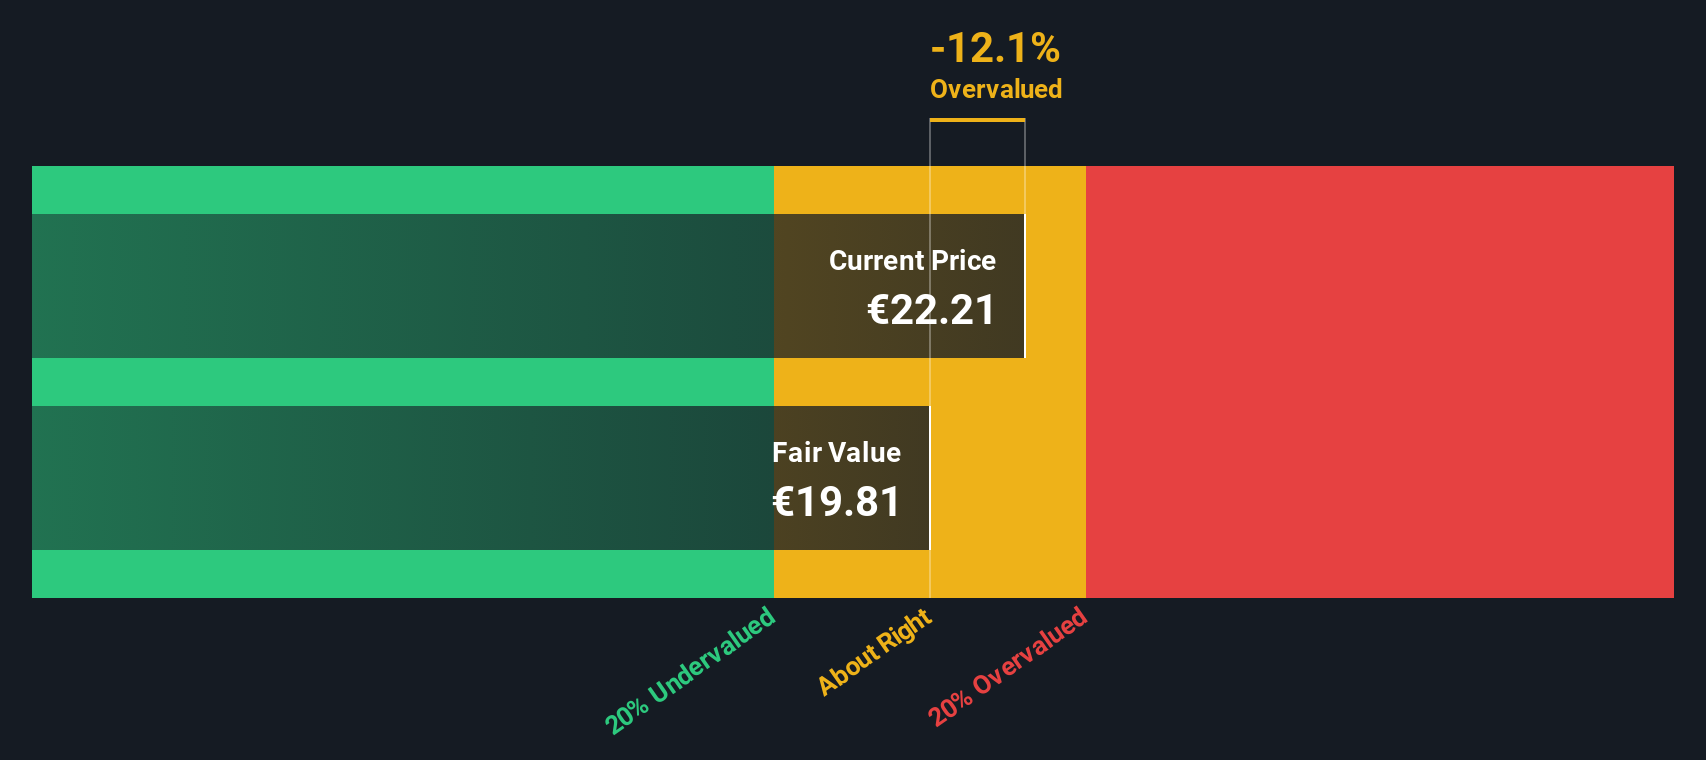
Based on these projections, the DCF model calculates PUMA’s fair value at €19.61 per share. With the intrinsic discount currently at -9.5%, this means PUMA’s stock price is trading just a little above its estimated fair value. This suggests that the stock is slightly overvalued by this measure but not by a wide margin.
Result: ABOUT RIGHT
Simply Wall St performs a valuation analysis on every stock in the world every day (check out PUMA's valuation analysis). We show the entire calculation in full. You can track the result in your watchlist or portfolio and be alerted when this changes.
Approach 2: PUMA Price vs Sales
For companies like PUMA, the Price-to-Sales (PS) ratio is a particularly useful valuation tool, especially when profitability is volatile or margins are thin. This metric helps investors compare how much the market is willing to pay for each euro of the company’s sales, providing a better sense of value when earnings are not consistently positive.
A "normal" PS ratio varies by industry, but it is also shaped by expectations for growth and risk. Typically, companies with faster growth or lower risk deserve a higher PS ratio, while those facing headwinds should trade lower.
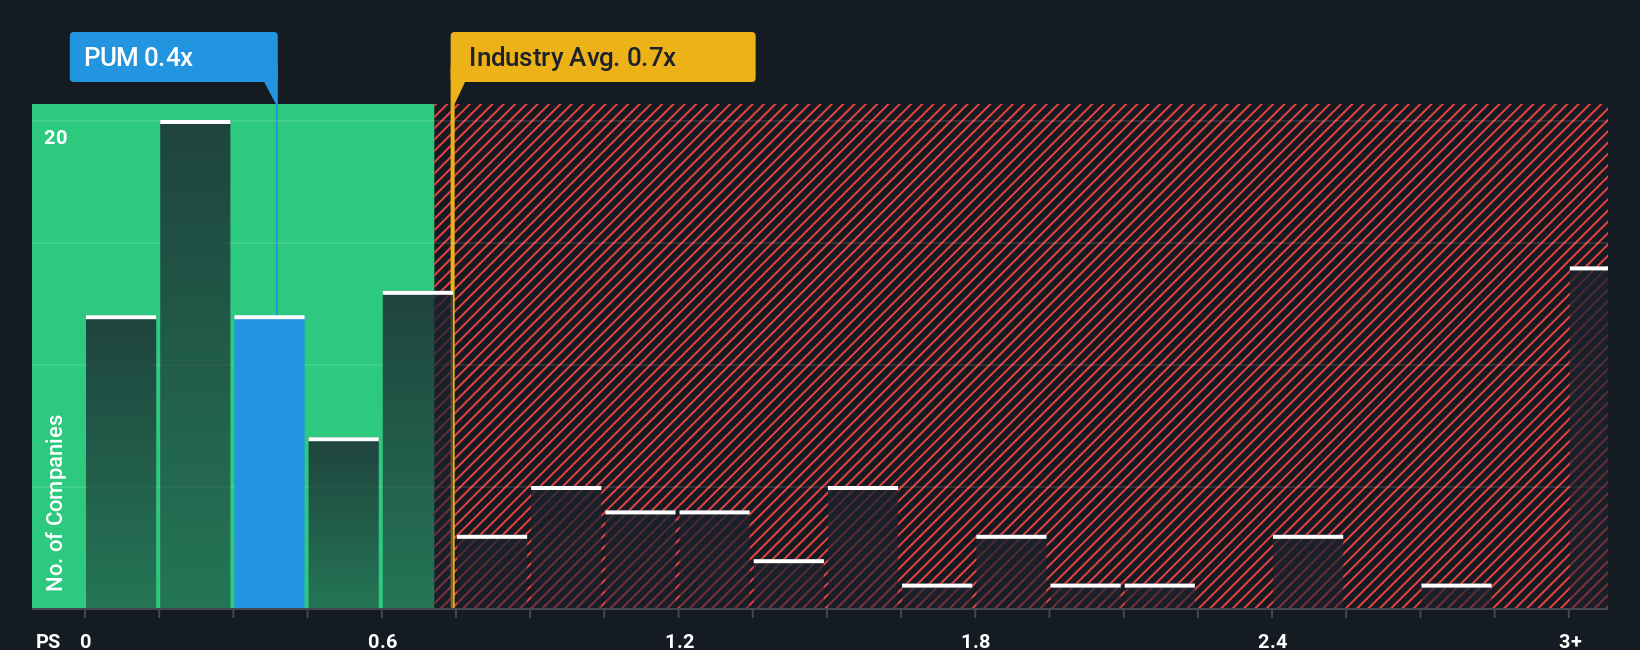
Currently, PUMA’s PS ratio stands at just 0.36x, meaning investors are paying only 36 cents for every euro of the company’s sales. This is well below the Luxury industry average of 0.85x and the relevant peer average of 0.94x. On the surface, this might signal an undervalued stock relative to similar companies.
However, Simply Wall St’s Fair Ratio takes things a step further. Unlike raw peer or industry comparisons, the Fair Ratio is tailored to PUMA’s growth outlook, profit margins, size, and unique risks. This offers a more nuanced benchmark for what would be considered "fair value." For PUMA, the Fair Ratio stands at 0.72x. Since the actual PS ratio (0.36x) sits significantly below this fair range, PUMA appears undervalued by this metric.
Result: UNDERVALUED
PS ratios tell one story, but what if the real opportunity lies elsewhere? Discover companies where insiders are betting big on explosive growth.
Upgrade Your Decision Making: Choose your PUMA Narrative
Earlier we mentioned that there is an even better way to understand valuation, so let's introduce you to Narratives. A Narrative is simply the story you believe about a company’s future, backed by your own assumptions for fair value, revenue growth, earnings, and margins. Instead of only relying on numbers, Narratives let you connect your view of PUMA’s prospects to a clear financial forecast and a calculated fair value. This makes your investment decision more meaningful and personal.
This approach is simple and accessible, and is available right now to millions of investors using the Community page on Simply Wall St. Narratives help you decide if PUMA is a buy or sell by directly comparing your calculated fair value to today’s market price. They also update automatically with every new development or earnings announcement.
For example, one investor’s Narrative might see PUMA surging higher based on an optimistic turnaround. Another might forecast continued challenges and a lower fair value. Narratives empower you to make decisions that fit your unique perspective and update as the story evolves.
Do you think there's more to the story for PUMA? Create your own Narrative to let the Community know!

This article by Simply Wall St is general in nature. We provide commentary based on historical data and analyst forecasts only using an unbiased methodology and our articles are not intended to be financial advice. It does not constitute a recommendation to buy or sell any stock, and does not take account of your objectives, or your financial situation. We aim to bring you long-term focused analysis driven by fundamental data. Note that our analysis may not factor in the latest price-sensitive company announcements or qualitative material. Simply Wall St has no position in any stocks mentioned.
New: Manage All Your Stock Portfolios in One Place
We've created the ultimate portfolio companion for stock investors, and it's free.
• Connect an unlimited number of Portfolios and see your total in one currency
• Be alerted to new Warning Signs or Risks via email or mobile
• Track the Fair Value of your stocks
Have feedback on this article? Concerned about the content? Get in touch with us directly. Alternatively, email editorial-team@simplywallst.com
About XTRA:PUM
PUMA
Engages in the development and sale of sports and sports lifestyle products in Germany, rest of Europe, the United States, North America, and internationally.
Adequate balance sheet and fair value.
Similar Companies
Market Insights

Advertisement
Community Narratives
The Next Phase of Energy Storage: How NeoVolta Is Tackling America’s Power Crunch
Fair Value US$7.50|35.1% undervalued
MA
Community Contributor
Why EnSilica is Worth Possibly 13x its Current Price
Fair Value UK£5.00|89.8% undervalued
DO
Community Contributor
M&A Activity, Industry Diversification & A Defense Contract Monopoly Will Push BWXT For Healthy Long-Term Growth
Fair Value US$220.00|15.2% undervalued
CL
Community Contributor
A case for Cassiar Gold Corp (TSXV: GLDC) to reach CAD$8-10 before 2030 (X30-37)
Fair Value CA$10.00|96.0% undervalued
AG
Community Contributor