Advertisement
Does Recent Stock Rally Signal a Turning Point for Adidas in 2025?

Simply Wall St
Reviewed by Bailey Pemberton
Thinking about what to do with adidas stock right now? You’re certainly not alone. With shares closing at 192.65 most recently, plenty of investors are weighing whether this is a moment to buy, hold, or steer clear. Let’s break things down together and see where the opportunities and the risks might be hiding.
adidas stock has had a wild ride over the past few years. The company delivered a remarkable 70.6% gain over the last three years, but that long-term growth masks a recent slump: year to date, shares are down 18.6%. Over the last year, adidas has slipped 13.7%. Yet, just in the last month, the stock clawed back 9.6%, a sign that some buyers see value after the drop. This recent momentum may have been influenced by renewed optimism in consumer discretionary stocks as investors look for opportunities during a more volatile period for global markets.
So, where does the valuation stand? If we break out the numbers, adidas scores a 3 out of 6 on our value check. That means it passes half the key tests for being undervalued, but not all of them. This puts it squarely in “potential, but not a screaming bargain” territory. Of course, each valuation measure tells a different story, and sometimes the market’s moves only make sense in hindsight.
Next, we’ll dig into the specific valuation metrics and see where adidas shines and where it still faces headwinds. And if you stick around, I’ll share a perspective that goes beyond the usual valuation checks, offering a potentially more powerful way to gauge what this stock is really worth.
Approach 1: adidas Discounted Cash Flow (DCF) Analysis
The Discounted Cash Flow (DCF) model estimates the value of adidas by projecting its future cash flows and discounting them back to today, reflecting both the company's potential and the risks of those projections. For this analysis, adidas’s most recent Free Cash Flow stands at €658 million, with analysts expecting that figure to grow significantly over the coming years.
Specifically, projections call for Free Cash Flow to cross into the billions. Analyst estimates foresee a rise to nearly €2.3 billion by 2026, and Simply Wall St’s extended forecasts extrapolate this further to around €9.1 billion by 2035. This growth outlook reflects expectations for a meaningful acceleration in adidas’s future profitability.
Based on this two-stage Free Cash Flow to Equity model, the estimated intrinsic value per share is €755.43. With the current share price closing at €192.65, the DCF model implies the stock is trading at a 74.5% discount to its calculated fair value. In simple terms, the model suggests the market is pricing in much weaker future prospects than what these forecasts anticipate.
Result: UNDERVALUED
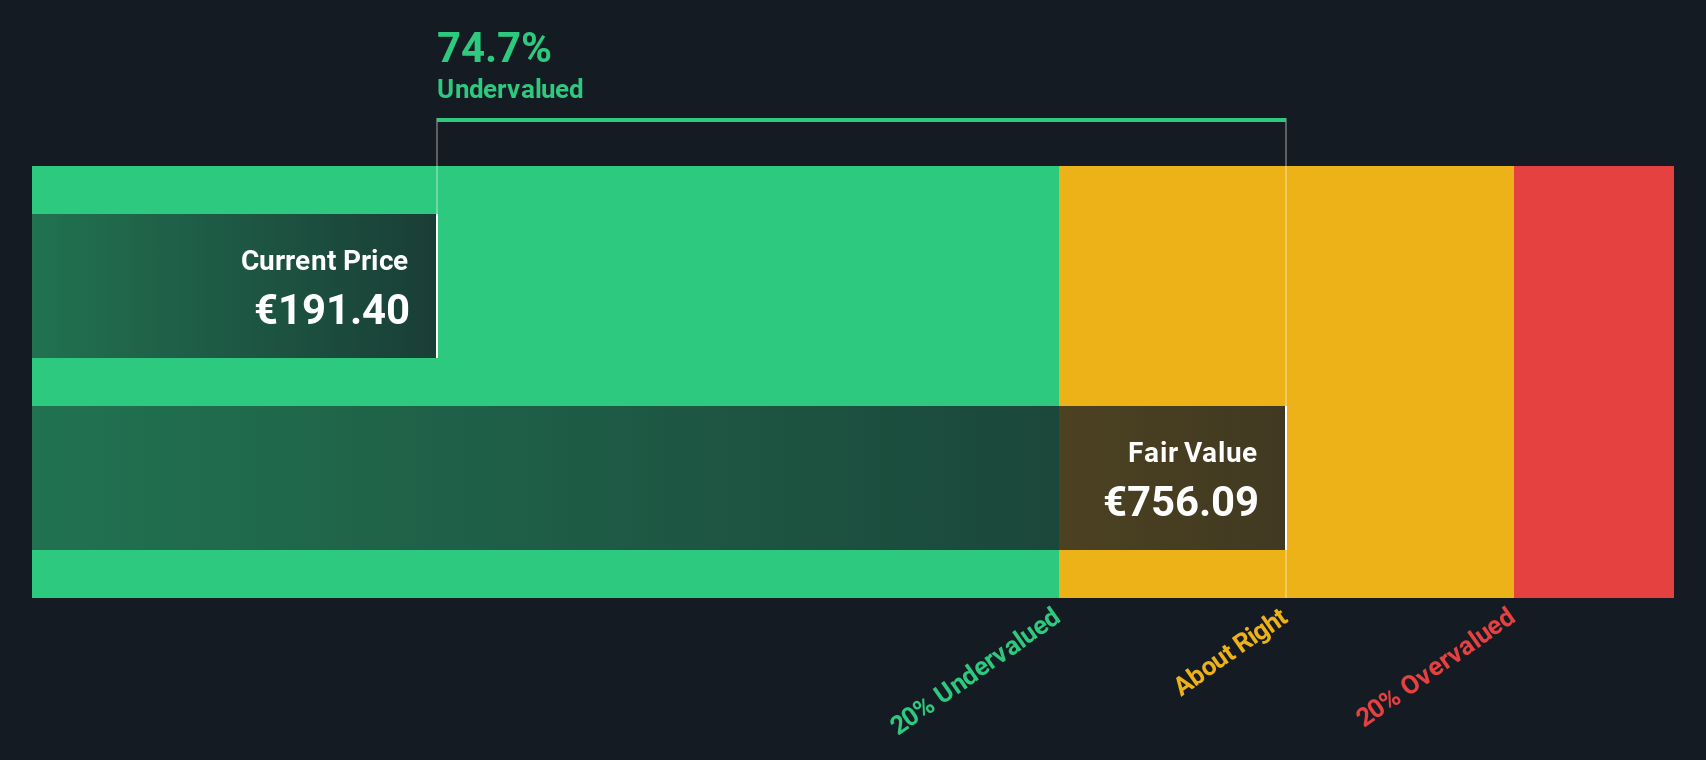
Our Discounted Cash Flow (DCF) analysis suggests adidas is undervalued by 74.5%. Track this in your watchlist or portfolio, or discover more undervalued stocks.
Approach 2: adidas Price vs Earnings
The Price-to-Earnings (PE) ratio is a popular valuation tool for analyzing profitable companies like adidas, as it reflects how much investors are willing to pay today for a euro of future earnings. For companies with steady profits, the PE ratio provides a quick way to gauge whether the stock is attractively valued relative to its earnings power.
However, what counts as a “normal” or “fair” PE ratio is not static. Expectations for future growth, company risk, profit margins, and even trends in the broader stock market all influence what investors are willing to pay. Fast-growing, lower-risk businesses generally command higher multiples, while mature or riskier firms tend to trade at lower ones.
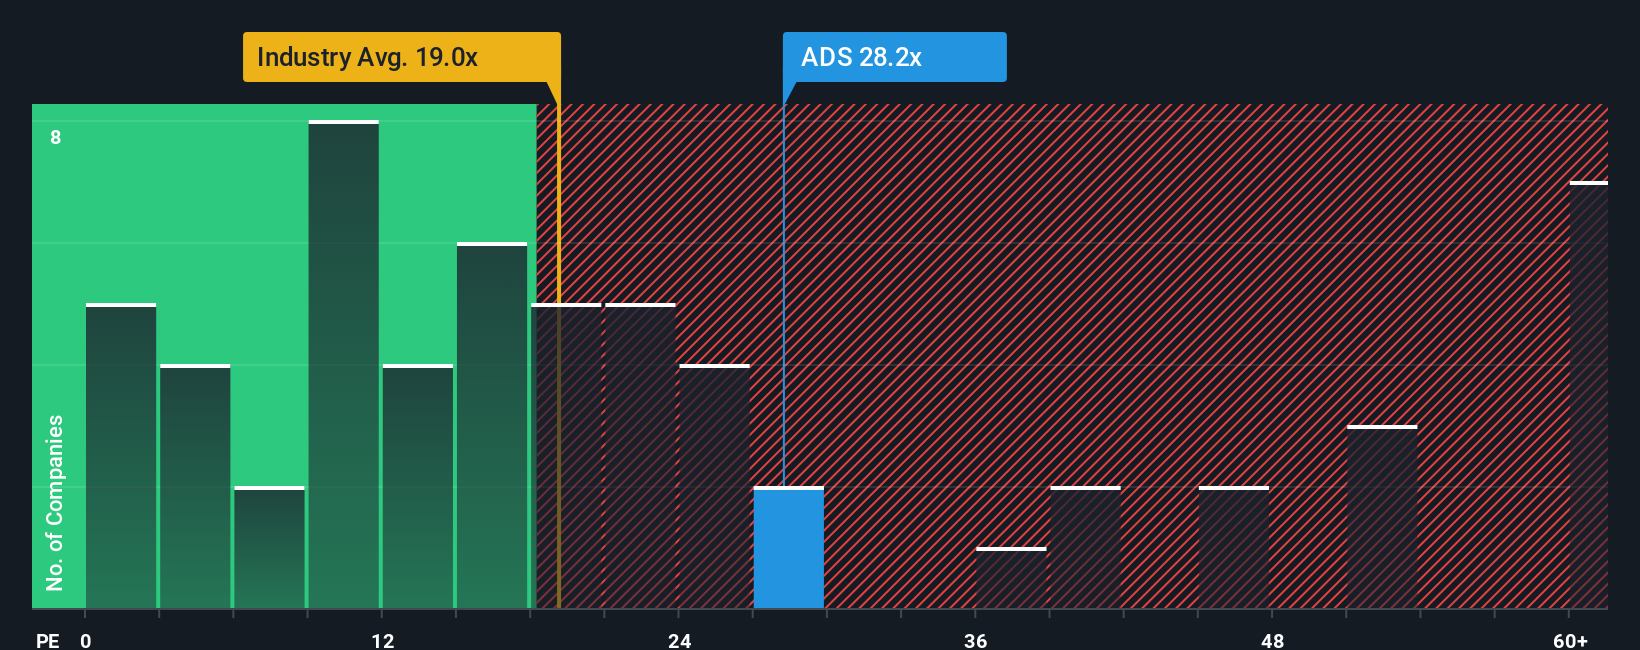
adidas currently sports a PE ratio of 29x. To put this in context, its peer group averages around 23.18x, while the luxury industry as a whole averages 18.32x. At first glance, this suggests adidas trades at a premium to the broader group. The Simply Wall St “Fair Ratio” for adidas is 20.91x, which takes into account adidas’s specific earnings growth outlook, risk profile, margins, and its industry position. Unlike a basic comparison to peers or the industry average, the Fair Ratio blends several fundamentals unique to adidas to give a more tailored benchmark.
Comparing adidas’s current PE of 29x with its Fair Ratio of 20.91x suggests the market is being optimistic, perhaps factoring in stronger future growth than current forecasts. With this substantial premium, the analysis points toward adidas being overvalued relative to these more customized metrics.
Result: OVERVALUED
PE ratios tell one story, but what if the real opportunity lies elsewhere? Discover companies where insiders are betting big on explosive growth.
Upgrade Your Decision Making: Choose your adidas Narrative
Earlier we mentioned that there is an even better way to understand valuation. Let's introduce you to Narratives. In simple terms, a Narrative is the story or perspective you bring to a company, connecting your expectations about its future, such as revenue, earnings, and margins, with a financial forecast and a fair value estimate. Narratives help bridge the gap between company news and hard numbers, letting you see how your outlook translates into concrete buy or sell signals.
On Simply Wall St’s platform, Narratives are an easy-to-use tool within the Community page, empowering millions of investors to outline their view on a company, share the numbers behind it, and see how those assumptions affect fair value compared to the current price. What makes Narratives especially powerful is how they update dynamically. When fresh news, analyst updates, or earnings are released, your Narrative refreshes automatically, so you always have the latest view.
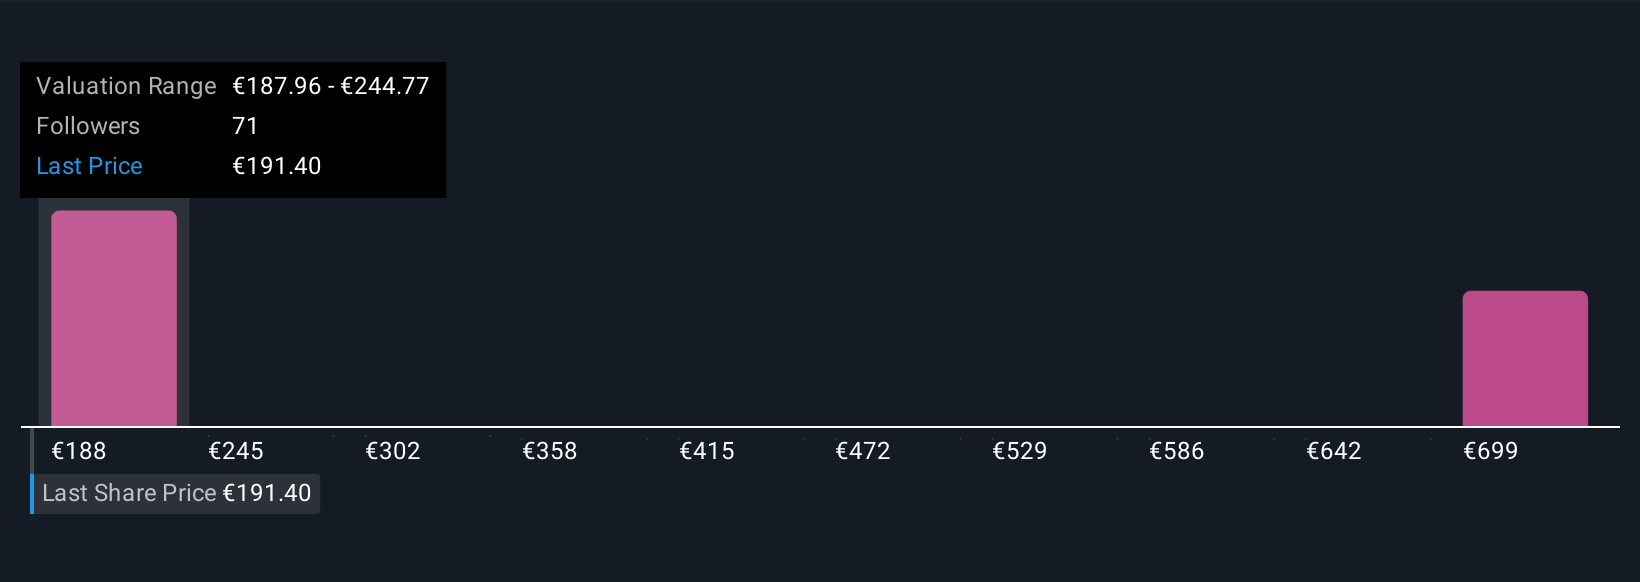
For example, some investors are optimistic and project adidas will achieve a price target of €280, based on rising health trends, margin growth, and global expansion, while others take a more cautious approach with a target as low as €182, reflecting concerns about tariffs, competition, and cost pressures. Narratives let you visualize, compare, and refine your thinking, making smarter investment decisions more accessible than ever.
Do you think there's more to the story for adidas? Create your own Narrative to let the Community know!
This article by Simply Wall St is general in nature. We provide commentary based on historical data and analyst forecasts only using an unbiased methodology and our articles are not intended to be financial advice. It does not constitute a recommendation to buy or sell any stock, and does not take account of your objectives, or your financial situation. We aim to bring you long-term focused analysis driven by fundamental data. Note that our analysis may not factor in the latest price-sensitive company announcements or qualitative material. Simply Wall St has no position in any stocks mentioned.
New: AI Stock Screener & Alerts
Our new AI Stock Screener scans the market every day to uncover opportunities.
• Dividend Powerhouses (3%+ Yield)
• Undervalued Small Caps with Insider Buying
• High growth Tech and AI Companies
Or build your own from over 50 metrics.
Have feedback on this article? Concerned about the content? Get in touch with us directly. Alternatively, email editorial-team@simplywallst.com
About XTRA:ADS
adidas
Designs, develops, produces, and markets athletic and sports lifestyle products in Europe, North America, Greater China, Latin America, Japan, and South Korea.
High growth potential with solid track record.
Similar Companies
Market Insights

Advertisement
Community Narratives
Kodiak AI - a potential 100 bagger opportunity?
Fair Value US$14.00|41.9% undervalued
DA
Community Contributor
A Fair Price for a Great Business Facing Real Threats
Fair Value US$383.06|14.1% undervalued
IM
Community Contributor
AXON And Shopify Integration Will Unlock Global Mobile Advertising
Fair Value US$613.59|1.3% undervalued
AN
Based on Analyst Price Targets