adidas' (ETR:ADS) investors will be pleased with their decent 43% return over the last year

These days it's easy to simply buy an index fund, and your returns should (roughly) match the market. But if you pick the right individual stocks, you could make more than that. For example, the adidas AG (ETR:ADS) share price is up 42% in the last 1 year, clearly besting the market return of around 2.2% (not including dividends). That's a solid performance by our standards! Zooming out, the stock is actually down 10% in the last three years.
Now it's worth having a look at the company's fundamentals too, because that will help us determine if the long term shareholder return has matched the performance of the underlying business.
Check out our latest analysis for adidas
To quote Buffett, 'Ships will sail around the world but the Flat Earth Society will flourish. There will continue to be wide discrepancies between price and value in the marketplace...' One imperfect but simple way to consider how the market perception of a company has shifted is to compare the change in the earnings per share (EPS) with the share price movement.
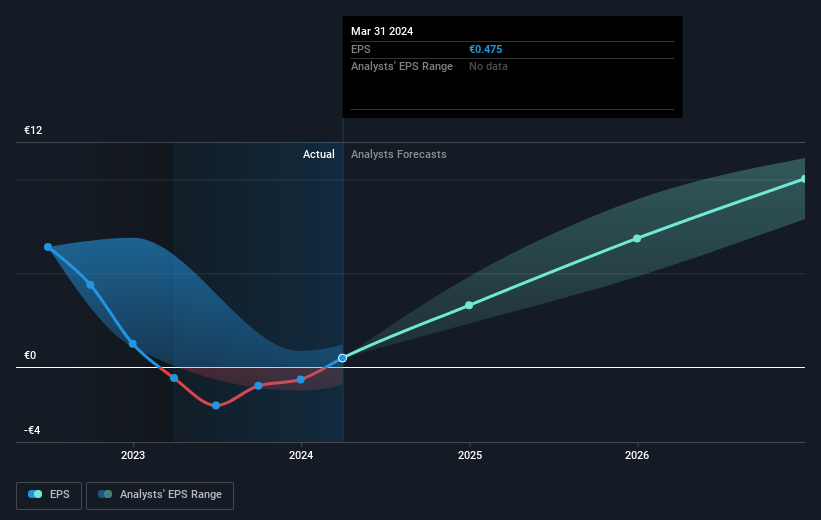
During the last year adidas grew its earnings per share, moving from a loss to a profit.
The company was close to break-even last year, so earnings per share of €0.48 isn't particularly stand out. We'd argue the positive share price reflects the move to profitability. Inflection points like this can be a great time to take a closer look at a company.
You can see below how EPS has changed over time (discover the exact values by clicking on the image).

We know that adidas has improved its bottom line lately, but is it going to grow revenue? You could check out this free report showing analyst revenue forecasts.
A Different Perspective
It's good to see that adidas has rewarded shareholders with a total shareholder return of 43% in the last twelve months. That's including the dividend. Notably the five-year annualised TSR loss of 1.0% per year compares very unfavourably with the recent share price performance. The long term loss makes us cautious, but the short term TSR gain certainly hints at a brighter future. You might want to assess this data-rich visualization of its earnings, revenue and cash flow.
Of course adidas may not be the best stock to buy. So you may wish to see this free collection of growth stocks.
Please note, the market returns quoted in this article reflect the market weighted average returns of stocks that currently trade on German exchanges.
New: AI Stock Screener & Alerts
Our new AI Stock Screener scans the market every day to uncover opportunities.
• Dividend Powerhouses (3%+ Yield)
• Undervalued Small Caps with Insider Buying
• High growth Tech and AI Companies
Or build your own from over 50 metrics.
Have feedback on this article? Concerned about the content? Get in touch with us directly. Alternatively, email editorial-team (at) simplywallst.com.
This article by Simply Wall St is general in nature. We provide commentary based on historical data and analyst forecasts only using an unbiased methodology and our articles are not intended to be financial advice. It does not constitute a recommendation to buy or sell any stock, and does not take account of your objectives, or your financial situation. We aim to bring you long-term focused analysis driven by fundamental data. Note that our analysis may not factor in the latest price-sensitive company announcements or qualitative material. Simply Wall St has no position in any stocks mentioned.
About XTRA:ADS
adidas
Designs, develops, produces, and markets athletic and sports lifestyle products in Europe, the Middle East, Africa, North America, Greater China, the Asia-Pacific, and Latin America.
High growth potential with excellent balance sheet.


