The 5.5% return delivered to Wacker Neuson's (ETR:WAC) shareholders actually lagged YoY earnings growth


For many, the main point of investing is to generate higher returns than the overall market. But every investor is virtually certain to have both over-performing and under-performing stocks. So we wouldn't blame long term Wacker Neuson SE (ETR:WAC) shareholders for doubting their decision to hold, with the stock down 11% over a half decade.
While the last five years has been tough for Wacker Neuson shareholders, this past week has shown signs of promise. So let's look at the longer term fundamentals and see if they've been the driver of the negative returns.
View our latest analysis for Wacker Neuson
In his essay The Superinvestors of Graham-and-Doddsville Warren Buffett described how share prices do not always rationally reflect the value of a business. One flawed but reasonable way to assess how sentiment around a company has changed is to compare the earnings per share (EPS) with the share price.
During the unfortunate half decade during which the share price slipped, Wacker Neuson actually saw its earnings per share (EPS) improve by 9.3% per year. So it doesn't seem like EPS is a great guide to understanding how the market is valuing the stock. Or possibly, the market was previously very optimistic, so the stock has disappointed, despite improving EPS.
It's strange to see such muted share price performance despite sustained growth. Perhaps a clue lies in other metrics.
We note that the dividend has remained healthy, so that wouldn't really explain the share price drop. While it's not completely obvious why the share price is down, a closer look at the company's history might help explain it.
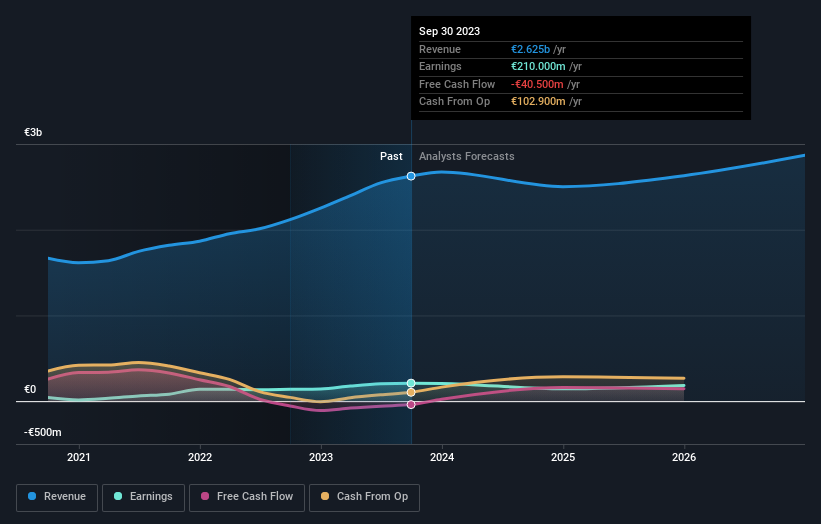
You can see below how earnings and revenue have changed over time (discover the exact values by clicking on the image).
It is of course excellent to see how Wacker Neuson has grown profits over the years, but the future is more important for shareholders. This free interactive report on Wacker Neuson's balance sheet strength is a great place to start, if you want to investigate the stock further.
What About Dividends?
As well as measuring the share price return, investors should also consider the total shareholder return (TSR). The TSR is a return calculation that accounts for the value of cash dividends (assuming that any dividend received was reinvested) and the calculated value of any discounted capital raisings and spin-offs. So for companies that pay a generous dividend, the TSR is often a lot higher than the share price return. In the case of Wacker Neuson, it has a TSR of 5.5% for the last 5 years. That exceeds its share price return that we previously mentioned. This is largely a result of its dividend payments!
A Different Perspective
Investors in Wacker Neuson had a tough year, with a total loss of 0.6% (including dividends), against a market gain of about 4.4%. However, keep in mind that even the best stocks will sometimes underperform the market over a twelve month period. On the bright side, long term shareholders have made money, with a gain of 1.1% per year over half a decade. If the fundamental data continues to indicate long term sustainable growth, the current sell-off could be an opportunity worth considering. It's always interesting to track share price performance over the longer term. But to understand Wacker Neuson better, we need to consider many other factors. For instance, we've identified 2 warning signs for Wacker Neuson (1 doesn't sit too well with us) that you should be aware of.
If you are like me, then you will not want to miss this free list of growing companies that insiders are buying.
Please note, the market returns quoted in this article reflect the market weighted average returns of stocks that currently trade on German exchanges.
Valuation is complex, but we're here to simplify it.
Discover if Wacker Neuson might be undervalued or overvalued with our detailed analysis, featuring fair value estimates, potential risks, dividends, insider trades, and its financial condition.
Access Free AnalysisHave feedback on this article? Concerned about the content? Get in touch with us directly. Alternatively, email editorial-team (at) simplywallst.com.
This article by Simply Wall St is general in nature. We provide commentary based on historical data and analyst forecasts only using an unbiased methodology and our articles are not intended to be financial advice. It does not constitute a recommendation to buy or sell any stock, and does not take account of your objectives, or your financial situation. We aim to bring you long-term focused analysis driven by fundamental data. Note that our analysis may not factor in the latest price-sensitive company announcements or qualitative material. Simply Wall St has no position in any stocks mentioned.
About XTRA:WAC
Wacker Neuson
Manufactures and distributes light and compact equipment in Germany, Austria, the United States, and internationally.
Flawless balance sheet, undervalued and pays a dividend.

