Advertisement
- Germany
- /
- Aerospace & Defense
- /
- XTRA:OHB
OHB (XTRA:OHB) Valuation: Is the Space Firm’s Steady Momentum Reflecting Its True Worth?

Simply Wall St
Reviewed by Kshitija Bhandaru
OHB (XTRA:OHB) shares have shown steady moves over the past month, drawing attention from investors interested in the company’s latest performance and its valuation. Let’s take a closer look at what is driving interest in the stock.
See our latest analysis for OHB.
OHB’s share price has edged up by 1.6% over the past month, maintaining a steady positive trend. Its 1-year total shareholder return sits at 2.9%. Recent moves suggest investor interest is holding firm, reflecting stable sentiment and modest momentum in the stock’s longer-term performance and valuation story.
If you’re interested in what else is gaining traction, now’s a great time to broaden your search and discover fast growing stocks with high insider ownership
The question now is whether OHB’s current valuation leaves room for investors to benefit, or if the market has already factored in all of the company’s future growth potential and left limited upside ahead.
Price-to-Sales Ratio of 3x: Is it justified?
OHB is currently trading at a price-to-sales (P/S) ratio of 3x, which is lower than the peer average of 3.9x. This positions the stock as relatively undervalued against similar companies, given the last close price of €174.5.
The price-to-sales ratio measures how much investors are willing to pay for each euro of revenue generated by the company. In sectors like Aerospace & Defense, where reliable profits may be hard to come by, the P/S ratio can be a helpful tool for comparing companies' relative value irrespective of earnings volatility or short-term fluctuations.
While OHB’s P/S ratio looks attractive when compared to its peers, it is actually higher than the European Aerospace & Defense industry average, which stands at 2.6x. This suggests that some market enthusiasm for OHB has already been priced in, even if there may still be a discount versus immediate rivals.
See what the numbers say about this price — find out in our valuation breakdown.
Result: Price-to-Sales of 3x (UNDERVALUED)
However, uncertainties around OHB's earnings growth and unpredictable sector dynamics remain potential risks that could quickly shift the outlook for investors.
Find out about the key risks to this OHB narrative.
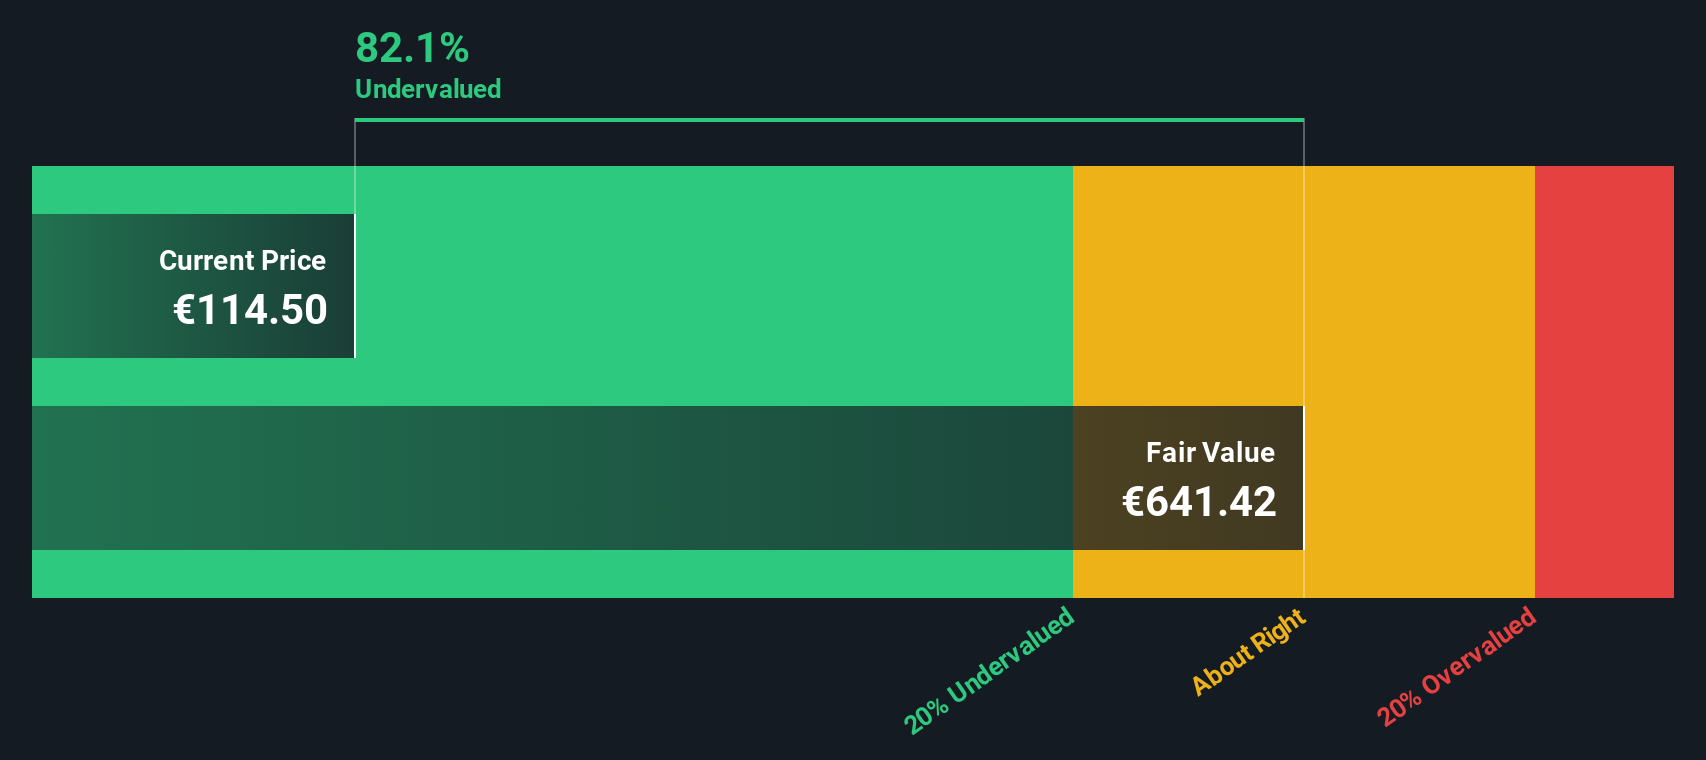
Another View: What Does the SWS DCF Model Say?
To balance the earlier valuation, the SWS DCF model offers a much more bullish perspective. It suggests that OHB's shares are trading at a steep 73.3% discount to their estimated fair value (€654.69). This implies a greater upside than the sales-based valuation points to. Is the market underestimating the company’s long-term prospects?
Look into how the SWS DCF model arrives at its fair value.
Simply Wall St performs a discounted cash flow (DCF) on every stock in the world every day (check out OHB for example). We show the entire calculation in full. You can track the result in your watchlist or portfolio and be alerted when this changes, or use our stock screener to discover undervalued stocks based on their cash flows. If you save a screener we even alert you when new companies match - so you never miss a potential opportunity.
Build Your Own OHB Narrative
If you’d rather draw your own conclusions or want to dive deeper into the numbers, you can build your own evidence-based narrative in just a few minutes. Do it your way
A great starting point for your OHB research is our analysis highlighting 1 key reward and 4 important warning signs that could impact your investment decision.
Looking for more investment ideas?
Smart investors always keep their radar up for the next standout opportunity. Get a jump on the crowd and act today by seeking out unique investments you might be missing.
- Capture the potential of next-gen finance and see which innovative companies are rising in these 78 cryptocurrency and blockchain stocks.
- Target future industry leaders and access high-yield opportunities by spotting these 19 dividend stocks with yields > 3% that consistently deliver value.
- Seize your edge early and assess undervalued gems among these 896 undervalued stocks based on cash flows poised for strong cash flow performance.
This article by Simply Wall St is general in nature. We provide commentary based on historical data and analyst forecasts only using an unbiased methodology and our articles are not intended to be financial advice. It does not constitute a recommendation to buy or sell any stock, and does not take account of your objectives, or your financial situation. We aim to bring you long-term focused analysis driven by fundamental data. Note that our analysis may not factor in the latest price-sensitive company announcements or qualitative material. Simply Wall St has no position in any stocks mentioned.
New: AI Stock Screener & Alerts
Our new AI Stock Screener scans the market every day to uncover opportunities.
• Dividend Powerhouses (3%+ Yield)
• Undervalued Small Caps with Insider Buying
• High growth Tech and AI Companies
Or build your own from over 50 metrics.
Have feedback on this article? Concerned about the content? Get in touch with us directly. Alternatively, email editorial-team@simplywallst.com
About XTRA:OHB
OHB
Operates as a space and technology company in Germany, rest of Europe, and internationally.
Excellent balance sheet with slight risk.
Market Insights

Advertisement
Community Narratives
The Next Phase of Energy Storage: How NeoVolta Is Tackling America’s Power Crunch
Fair Value US$7.50|35.1% undervalued
MA
Community Contributor
Why EnSilica is Worth Possibly 13x its Current Price
Fair Value UK£5.00|89.8% undervalued
DO
Community Contributor
M&A Activity, Industry Diversification & A Defense Contract Monopoly Will Push BWXT For Healthy Long-Term Growth
Fair Value US$220.00|15.2% undervalued
CL
Community Contributor
A case for Cassiar Gold Corp (TSXV: GLDC) to reach CAD$8-10 before 2030 (X30-37)
Fair Value CA$10.00|96.0% undervalued
AG
Community Contributor