NORMA Group SE (ETR:NOEJ) Shares Could Be 47% Below Their Intrinsic Value Estimate


Key Insights
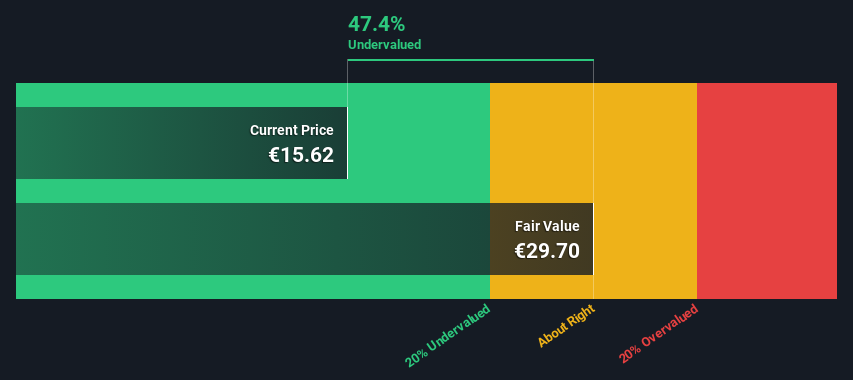
- The projected fair value for NORMA Group is €29.70 based on 2 Stage Free Cash Flow to Equity
- NORMA Group's €15.62 share price signals that it might be 47% undervalued
- The €21.30 analyst price target for NOEJ is 28% less than our estimate of fair value
Today we'll do a simple run through of a valuation method used to estimate the attractiveness of NORMA Group SE (ETR:NOEJ) as an investment opportunity by estimating the company's future cash flows and discounting them to their present value. This will be done using the Discounted Cash Flow (DCF) model. It may sound complicated, but actually it is quite simple!
Companies can be valued in a lot of ways, so we would point out that a DCF is not perfect for every situation. Anyone interested in learning a bit more about intrinsic value should have a read of the Simply Wall St analysis model.
See our latest analysis for NORMA Group
Is NORMA Group Fairly Valued?
We use what is known as a 2-stage model, which simply means we have two different periods of growth rates for the company's cash flows. Generally the first stage is higher growth, and the second stage is a lower growth phase. To start off with, we need to estimate the next ten years of cash flows. Where possible we use analyst estimates, but when these aren't available we extrapolate the previous free cash flow (FCF) from the last estimate or reported value. We assume companies with shrinking free cash flow will slow their rate of shrinkage, and that companies with growing free cash flow will see their growth rate slow, over this period. We do this to reflect that growth tends to slow more in the early years than it does in later years.
Generally we assume that a dollar today is more valuable than a dollar in the future, and so the sum of these future cash flows is then discounted to today's value:
10-year free cash flow (FCF) forecast
| 2025 | 2026 | 2027 | 2028 | 2029 | 2030 | 2031 | 2032 | 2033 | 2034 | |
| Levered FCF (€, Millions) | €61.0m | €72.4m | €66.7m | €63.3m | €61.1m | €59.8m | €59.1m | €58.7m | €58.6m | €58.6m |
| Growth Rate Estimate Source | Analyst x4 | Analyst x4 | Est @ -7.78% | Est @ -5.20% | Est @ -3.40% | Est @ -2.14% | Est @ -1.25% | Est @ -0.63% | Est @ -0.20% | Est @ 0.10% |
| Present Value (€, Millions) Discounted @ 6.8% | €57.1 | €63.4 | €54.7 | €48.5 | €43.9 | €40.2 | €37.1 | €34.5 | €32.3 | €30.2 |
("Est" = FCF growth rate estimated by Simply Wall St)
Present Value of 10-year Cash Flow (PVCF) = €442m
The second stage is also known as Terminal Value, this is the business's cash flow after the first stage. For a number of reasons a very conservative growth rate is used that cannot exceed that of a country's GDP growth. In this case we have used the 5-year average of the 10-year government bond yield (0.8%) to estimate future growth. In the same way as with the 10-year 'growth' period, we discount future cash flows to today's value, using a cost of equity of 6.8%.
Terminal Value (TV)= FCF2034 × (1 + g) ÷ (r – g) = €59m× (1 + 0.8%) ÷ (6.8%– 0.8%) = €979m
Present Value of Terminal Value (PVTV)= TV / (1 + r)10= €979m÷ ( 1 + 6.8%)10= €505m
The total value, or equity value, is then the sum of the present value of the future cash flows, which in this case is €946m. The last step is to then divide the equity value by the number of shares outstanding. Relative to the current share price of €15.6, the company appears quite good value at a 47% discount to where the stock price trades currently. Valuations are imprecise instruments though, rather like a telescope - move a few degrees and end up in a different galaxy. Do keep this in mind.
The Assumptions
We would point out that the most important inputs to a discounted cash flow are the discount rate and of course the actual cash flows. If you don't agree with these result, have a go at the calculation yourself and play with the assumptions. The DCF also does not consider the possible cyclicality of an industry, or a company's future capital requirements, so it does not give a full picture of a company's potential performance. Given that we are looking at NORMA Group as potential shareholders, the cost of equity is used as the discount rate, rather than the cost of capital (or weighted average cost of capital, WACC) which accounts for debt. In this calculation we've used 6.8%, which is based on a levered beta of 1.466. Beta is a measure of a stock's volatility, compared to the market as a whole. We get our beta from the industry average beta of globally comparable companies, with an imposed limit between 0.8 and 2.0, which is a reasonable range for a stable business.
SWOT Analysis for NORMA Group
- Debt is well covered by cash flow.
- Dividends are covered by earnings and cash flows.
- Earnings declined over the past year.
- Interest payments on debt are not well covered.
- Dividend is low compared to the top 25% of dividend payers in the Machinery market.
- Annual earnings are forecast to grow faster than the German market.
- Good value based on P/E ratio and estimated fair value.
- Annual revenue is forecast to grow slower than the German market.
Moving On:
Although the valuation of a company is important, it is only one of many factors that you need to assess for a company. The DCF model is not a perfect stock valuation tool. Preferably you'd apply different cases and assumptions and see how they would impact the company's valuation. If a company grows at a different rate, or if its cost of equity or risk free rate changes sharply, the output can look very different. What is the reason for the share price sitting below the intrinsic value? For NORMA Group, there are three essential elements you should further examine:
- Risks: Take risks, for example - NORMA Group has 2 warning signs (and 1 which is potentially serious) we think you should know about.
- Future Earnings: How does NOEJ's growth rate compare to its peers and the wider market? Dig deeper into the analyst consensus number for the upcoming years by interacting with our free analyst growth expectation chart.
- Other High Quality Alternatives: Do you like a good all-rounder? Explore our interactive list of high quality stocks to get an idea of what else is out there you may be missing!
PS. The Simply Wall St app conducts a discounted cash flow valuation for every stock on the XTRA every day. If you want to find the calculation for other stocks just search here.
If you're looking to trade NORMA Group, open an account with the lowest-cost platform trusted by professionals, Interactive Brokers.
With clients in over 200 countries and territories, and access to 160 markets, IBKR lets you trade stocks, options, futures, forex, bonds and funds from a single integrated account.
Enjoy no hidden fees, no account minimums, and FX conversion rates as low as 0.03%, far better than what most brokers offer.
Sponsored ContentValuation is complex, but we're here to simplify it.
Discover if NORMA Group might be undervalued or overvalued with our detailed analysis, featuring fair value estimates, potential risks, dividends, insider trades, and its financial condition.
Access Free AnalysisHave feedback on this article? Concerned about the content? Get in touch with us directly. Alternatively, email editorial-team (at) simplywallst.com.
This article by Simply Wall St is general in nature. We provide commentary based on historical data and analyst forecasts only using an unbiased methodology and our articles are not intended to be financial advice. It does not constitute a recommendation to buy or sell any stock, and does not take account of your objectives, or your financial situation. We aim to bring you long-term focused analysis driven by fundamental data. Note that our analysis may not factor in the latest price-sensitive company announcements or qualitative material. Simply Wall St has no position in any stocks mentioned.
Have feedback on this article? Concerned about the content? Get in touch with us directly. Alternatively, email editorial-team@simplywallst.com
About XTRA:NOEJ
NORMA Group
Manufactures and sells engineered joining technology solutions in Europe, the Middle East, Africa, the Americas, and the Asia-Pacific.
Good value with adequate balance sheet.

