
Advertisement
- Germany
- /
- Electrical
- /
- XTRA:NDX1
Nordex (ETR:NDX1) shareholder returns have been solid, earning 148% in 5 years
The worst result, after buying shares in a company (assuming no leverage), would be if you lose all the money you put in. But on a lighter note, a good company can see its share price rise well over 100%. For example, the Nordex SE (ETR:NDX1) share price has soared 117% in the last half decade. Most would be very happy with that. On top of that, the share price is up 42% in about a quarter. The company reported its financial results recently; you can catch up on the latest numbers by reading our company report.
Since the stock has added €154m to its market cap in the past week alone, let's see if underlying performance has been driving long-term returns.
Given that Nordex only made minimal earnings in the last twelve months, we'll focus on revenue to gauge its business development. As a general rule, we think this kind of company is more comparable to loss-making stocks, since the actual profit is so low. It would be hard to believe in a more profitable future without growing revenues.
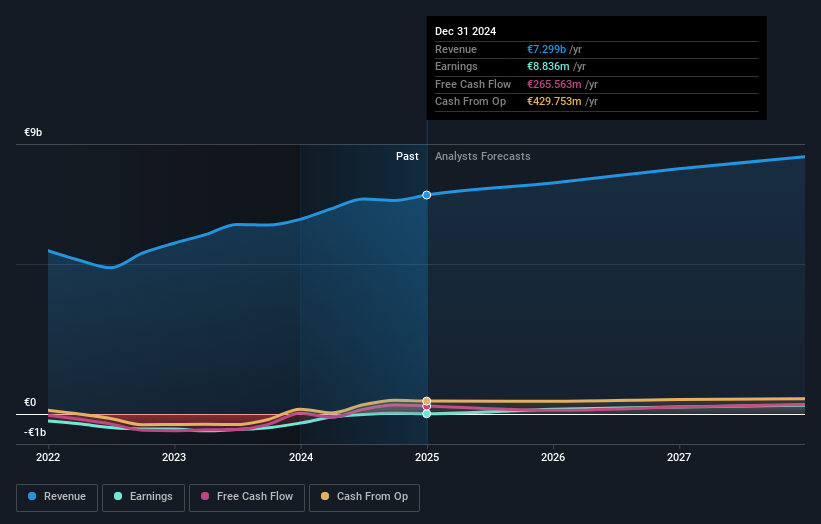
In the last 5 years Nordex saw its revenue grow at 12% per year. That's a fairly respectable growth rate. Broadly speaking, this solid progress may well be reflected by the healthy share price gain of 17% per year over five years. It's well worth monitoring the growth trend in revenue, because if growth accelerates, that might signal an opportunity. When a growth trend accelerates, be it in revenue or earnings, it can indicate an inflection point for the business, which is can often be an opportunity for investors.
You can see below how earnings and revenue have changed over time (discover the exact values by clicking on the image).
Nordex is well known by investors, and plenty of clever analysts have tried to predict the future profit levels. You can see what analysts are predicting for Nordex in this interactive graph of future profit estimates.
What About The Total Shareholder Return (TSR)?
Investors should note that there's a difference between Nordex's total shareholder return (TSR) and its share price change, which we've covered above. The TSR is a return calculation that accounts for the value of cash dividends (assuming that any dividend received was reinvested) and the calculated value of any discounted capital raisings and spin-offs. We note that Nordex's TSR, at 148% is higher than its share price return of 117%. When you consider it hasn't been paying a dividend, this data suggests shareholders have benefitted from a spin-off, or had the opportunity to acquire attractively priced shares in a discounted capital raising.
A Different Perspective
It's nice to see that Nordex shareholders have received a total shareholder return of 36% over the last year. That's better than the annualised return of 20% over half a decade, implying that the company is doing better recently. In the best case scenario, this may hint at some real business momentum, implying that now could be a great time to delve deeper. While it is well worth considering the different impacts that market conditions can have on the share price, there are other factors that are even more important. For example, we've discovered 1 warning sign for Nordex that you should be aware of before investing here.
But note: Nordex may not be the best stock to buy. So take a peek at this free list of interesting companies with past earnings growth (and further growth forecast).
Please note, the market returns quoted in this article reflect the market weighted average returns of stocks that currently trade on German exchanges.
Valuation is complex, but we're here to simplify it.
Discover if Nordex might be undervalued or overvalued with our detailed analysis, featuring fair value estimates, potential risks, dividends, insider trades, and its financial condition.
Access Free AnalysisHave feedback on this article? Concerned about the content? Get in touch with us directly. Alternatively, email editorial-team (at) simplywallst.com.
This article by Simply Wall St is general in nature. We provide commentary based on historical data and analyst forecasts only using an unbiased methodology and our articles are not intended to be financial advice. It does not constitute a recommendation to buy or sell any stock, and does not take account of your objectives, or your financial situation. We aim to bring you long-term focused analysis driven by fundamental data. Note that our analysis may not factor in the latest price-sensitive company announcements or qualitative material. Simply Wall St has no position in any stocks mentioned.
About XTRA:NDX1
Nordex
Develops, manufactures, and distributes multi-megawatt onshore wind turbines worldwide.
Excellent balance sheet with reasonable growth potential.
Similar Companies
Market Insights


Advertisement
Community Narratives
The Future of Drug Testing? Fingerprint Tech Shows Serious Promise
Fair Value US$2.98|40.3% undervalued
JO
Community Contributor
Suncorp’s Next Chapter: Insurance-Only and Ready to Grow
Fair Value AU$22.83|7.6% undervalued
RO
Community Contributor
Thyssenkrupp Nucera Will Achieve Double-Digit Profits by 2030 Boosted by Hydrogen Growth
Fair Value €14.40|30.6% undervalued
CH
Community Contributor
Tesla’s Nvidia Moment – The AI & Robotics Inflection Point
Fair Value US$359.72|12.3% undervalued
BL
Community Contributor