

Some say volatility, rather than debt, is the best way to think about risk as an investor, but Warren Buffett famously said that 'Volatility is far from synonymous with risk.' It's only natural to consider a company's balance sheet when you examine how risky it is, since debt is often involved when a business collapses. As with many other companies KION GROUP AG (ETR:KGX) makes use of debt. But the more important question is: how much risk is that debt creating?
When Is Debt Dangerous?
Debt and other liabilities become risky for a business when it cannot easily fulfill those obligations, either with free cash flow or by raising capital at an attractive price. If things get really bad, the lenders can take control of the business. However, a more common (but still painful) scenario is that it has to raise new equity capital at a low price, thus permanently diluting shareholders. Of course, debt can be an important tool in businesses, particularly capital heavy businesses. The first thing to do when considering how much debt a business uses is to look at its cash and debt together.
See our latest analysis for KION GROUP
What Is KION GROUP's Net Debt?
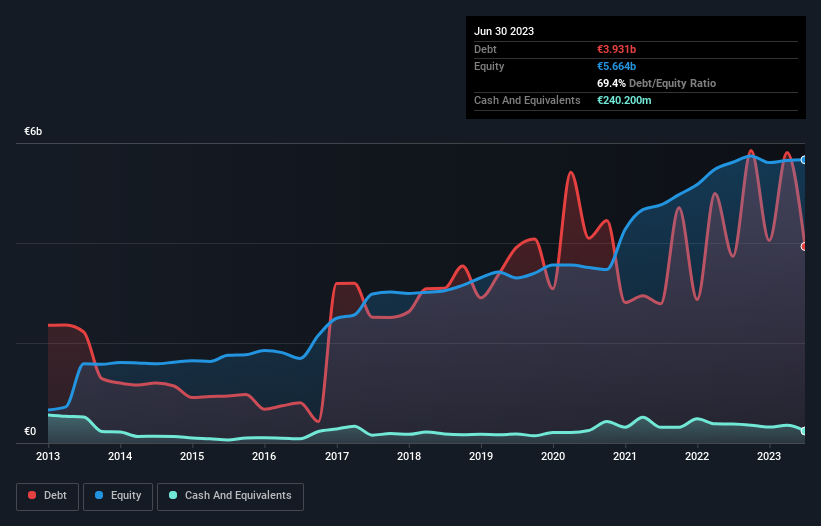
The image below, which you can click on for greater detail, shows that at June 2023 KION GROUP had debt of €3.93b, up from €3.74b in one year. On the flip side, it has €240.2m in cash leading to net debt of about €3.69b.
How Healthy Is KION GROUP's Balance Sheet?
According to the last reported balance sheet, KION GROUP had liabilities of €5.35b due within 12 months, and liabilities of €6.00b due beyond 12 months. Offsetting this, it had €240.2m in cash and €2.89b in receivables that were due within 12 months. So its liabilities outweigh the sum of its cash and (near-term) receivables by €8.23b.
The deficiency here weighs heavily on the €4.40b company itself, as if a child were struggling under the weight of an enormous back-pack full of books, his sports gear, and a trumpet. So we definitely think shareholders need to watch this one closely. At the end of the day, KION GROUP would probably need a major re-capitalization if its creditors were to demand repayment.
We use two main ratios to inform us about debt levels relative to earnings. The first is net debt divided by earnings before interest, tax, depreciation, and amortization (EBITDA), while the second is how many times its earnings before interest and tax (EBIT) covers its interest expense (or its interest cover, for short). The advantage of this approach is that we take into account both the absolute quantum of debt (with net debt to EBITDA) and the actual interest expenses associated with that debt (with its interest cover ratio).
While we wouldn't worry about KION GROUP's net debt to EBITDA ratio of 3.5, we think its super-low interest cover of 1.9 times is a sign of high leverage. In large part that's due to the company's significant depreciation and amortisation charges, which arguably mean its EBITDA is a very generous measure of earnings, and its debt may be more of a burden than it first appears. It seems clear that the cost of borrowing money is negatively impacting returns for shareholders, of late. Even worse, KION GROUP saw its EBIT tank 72% over the last 12 months. If earnings keep going like that over the long term, it has a snowball's chance in hell of paying off that debt. There's no doubt that we learn most about debt from the balance sheet. But ultimately the future profitability of the business will decide if KION GROUP can strengthen its balance sheet over time. So if you're focused on the future you can check out this free report showing analyst profit forecasts.
Finally, a company can only pay off debt with cold hard cash, not accounting profits. So we clearly need to look at whether that EBIT is leading to corresponding free cash flow. In the last three years, KION GROUP's free cash flow amounted to 30% of its EBIT, less than we'd expect. That's not great, when it comes to paying down debt.
Our View
On the face of it, KION GROUP's EBIT growth rate left us tentative about the stock, and its level of total liabilities was no more enticing than the one empty restaurant on the busiest night of the year. And even its net debt to EBITDA fails to inspire much confidence. After considering the datapoints discussed, we think KION GROUP has too much debt. That sort of riskiness is ok for some, but it certainly doesn't float our boat. When analysing debt levels, the balance sheet is the obvious place to start. But ultimately, every company can contain risks that exist outside of the balance sheet. We've identified 2 warning signs with KION GROUP (at least 1 which is concerning) , and understanding them should be part of your investment process.
If, after all that, you're more interested in a fast growing company with a rock-solid balance sheet, then check out our list of net cash growth stocks without delay.
If you're looking to trade KION GROUP, open an account with the lowest-cost platform trusted by professionals, Interactive Brokers.
With clients in over 200 countries and territories, and access to 160 markets, IBKR lets you trade stocks, options, futures, forex, bonds and funds from a single integrated account.
Enjoy no hidden fees, no account minimums, and FX conversion rates as low as 0.03%, far better than what most brokers offer.
Sponsored ContentValuation is complex, but we're here to simplify it.
Discover if KION GROUP might be undervalued or overvalued with our detailed analysis, featuring fair value estimates, potential risks, dividends, insider trades, and its financial condition.
Access Free AnalysisHave feedback on this article? Concerned about the content? Get in touch with us directly. Alternatively, email editorial-team (at) simplywallst.com.
This article by Simply Wall St is general in nature. We provide commentary based on historical data and analyst forecasts only using an unbiased methodology and our articles are not intended to be financial advice. It does not constitute a recommendation to buy or sell any stock, and does not take account of your objectives, or your financial situation. We aim to bring you long-term focused analysis driven by fundamental data. Note that our analysis may not factor in the latest price-sensitive company announcements or qualitative material. Simply Wall St has no position in any stocks mentioned.
About XTRA:KGX
KION GROUP
Provides industrial trucks and supply chain solutions in Western and Eastern Europe, the Middle East, Africa, North America, Central and South America, China, and the rest of the Asia Pacific.
Undervalued with proven track record and pays a dividend.

