
Advertisement
Amidst the backdrop of a mixed global market, the European stock landscape has shown resilience with the pan-European STOXX Europe 600 Index climbing 3.93% over a recent week, buoyed by positive investor sentiment following President Trump's tariff delay and signals of potential interest rate cuts by the ECB. In such an environment, dividend stocks can offer a compelling opportunity for investors seeking stable income streams; these stocks often provide consistent returns that can help cushion portfolios against market volatility and economic uncertainties.
Top 10 Dividend Stocks In Europe
| Name | Dividend Yield | Dividend Rating |
| Julius Bär Gruppe (SWX:BAER) | 5.26% | ★★★★★★ |
| Bredband2 i Skandinavien (OM:BRE2) | 4.81% | ★★★★★★ |
| Zurich Insurance Group (SWX:ZURN) | 4.50% | ★★★★★★ |
| Mapfre (BME:MAP) | 5.48% | ★★★★★★ |
| OVB Holding (XTRA:O4B) | 4.46% | ★★★★★★ |
| HEXPOL (OM:HPOL B) | 5.07% | ★★★★★★ |
| Deutsche Post (XTRA:DHL) | 5.14% | ★★★★★★ |
| Cembra Money Bank (SWX:CMBN) | 4.23% | ★★★★★★ |
| Rubis (ENXTPA:RUI) | 7.32% | ★★★★★★ |
| Banque Cantonale Vaudoise (SWX:BCVN) | 4.45% | ★★★★★★ |
Click here to see the full list of 247 stocks from our Top European Dividend Stocks screener.
Underneath we present a selection of stocks filtered out by our screen.
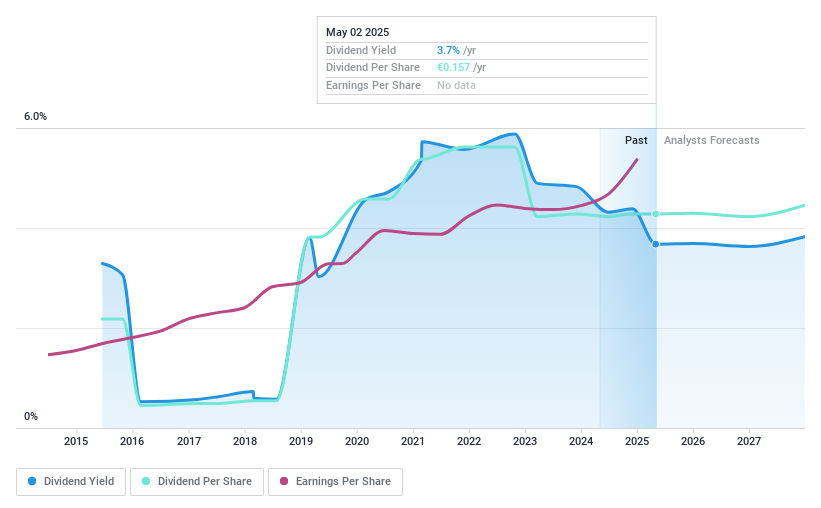
Faes Farma (BME:FAE)
Simply Wall St Dividend Rating: ★★★★☆☆
Overview: Faes Farma, S.A. is involved in the research, development, production, and marketing of pharmaceutical and healthcare products as well as raw materials globally, with a market cap of €1.25 billion.
Operations: Faes Farma generates revenue primarily from its Pharmaceutical Specialties and Healthcare segment (€455.21 million) and Nutrition and Animal Health segment (€52.20 million).
Dividend Yield: 3.9%
Faes Farma's dividend payments have increased over the past decade, supported by a reasonable payout ratio of 50.3%, indicating coverage by earnings. However, its yield of 3.91% is lower than the top 25% in Spain's market. Despite trading at good value and below fair value estimates, Faes Farma has an unstable dividend track record with volatility over the past ten years. Earnings grew recently but are forecasted to decline annually by 2.3% over three years.
- Click here and access our complete dividend analysis report to understand the dynamics of Faes Farma.
- Our valuation report here indicates Faes Farma may be undervalued.
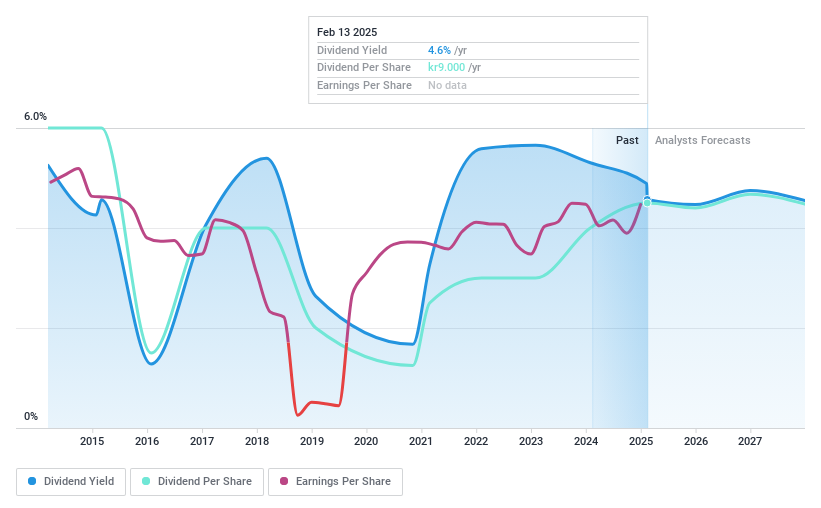
NCC (OM:NCC B)
Simply Wall St Dividend Rating: ★★★★☆☆
Overview: NCC AB (publ) is a construction company operating in Sweden, Norway, Denmark, and Finland with a market cap of SEK17.93 billion.
Operations: NCC AB (publ) generates revenue through its segments: NCC Industry with SEK12.63 billion, NCC Infrastructure at SEK18.11 billion, NCC Building Sweden totaling SEK14.01 billion, NCC Building Nordics with SEK13.88 billion, and NCC Property Development contributing SEK4.85 billion.
Dividend Yield: 4.9%
NCC's dividend yield is among the top 25% in Sweden, supported by a reasonable payout ratio of 56% and strong cash flow coverage at 22.7%. Despite its attractive valuation, NCC's dividend history has been volatile over the past decade. Recent projects, such as a SEK 150 million contract for Malardalen University and an SEK 160 million recycling center for LKAB, highlight NCC's robust order pipeline. Additionally, the proposed extra dividend underscores management's commitment to shareholder returns.
- Click to explore a detailed breakdown of our findings in NCC's dividend report.
- According our valuation report, there's an indication that NCC's share price might be on the cheaper side.
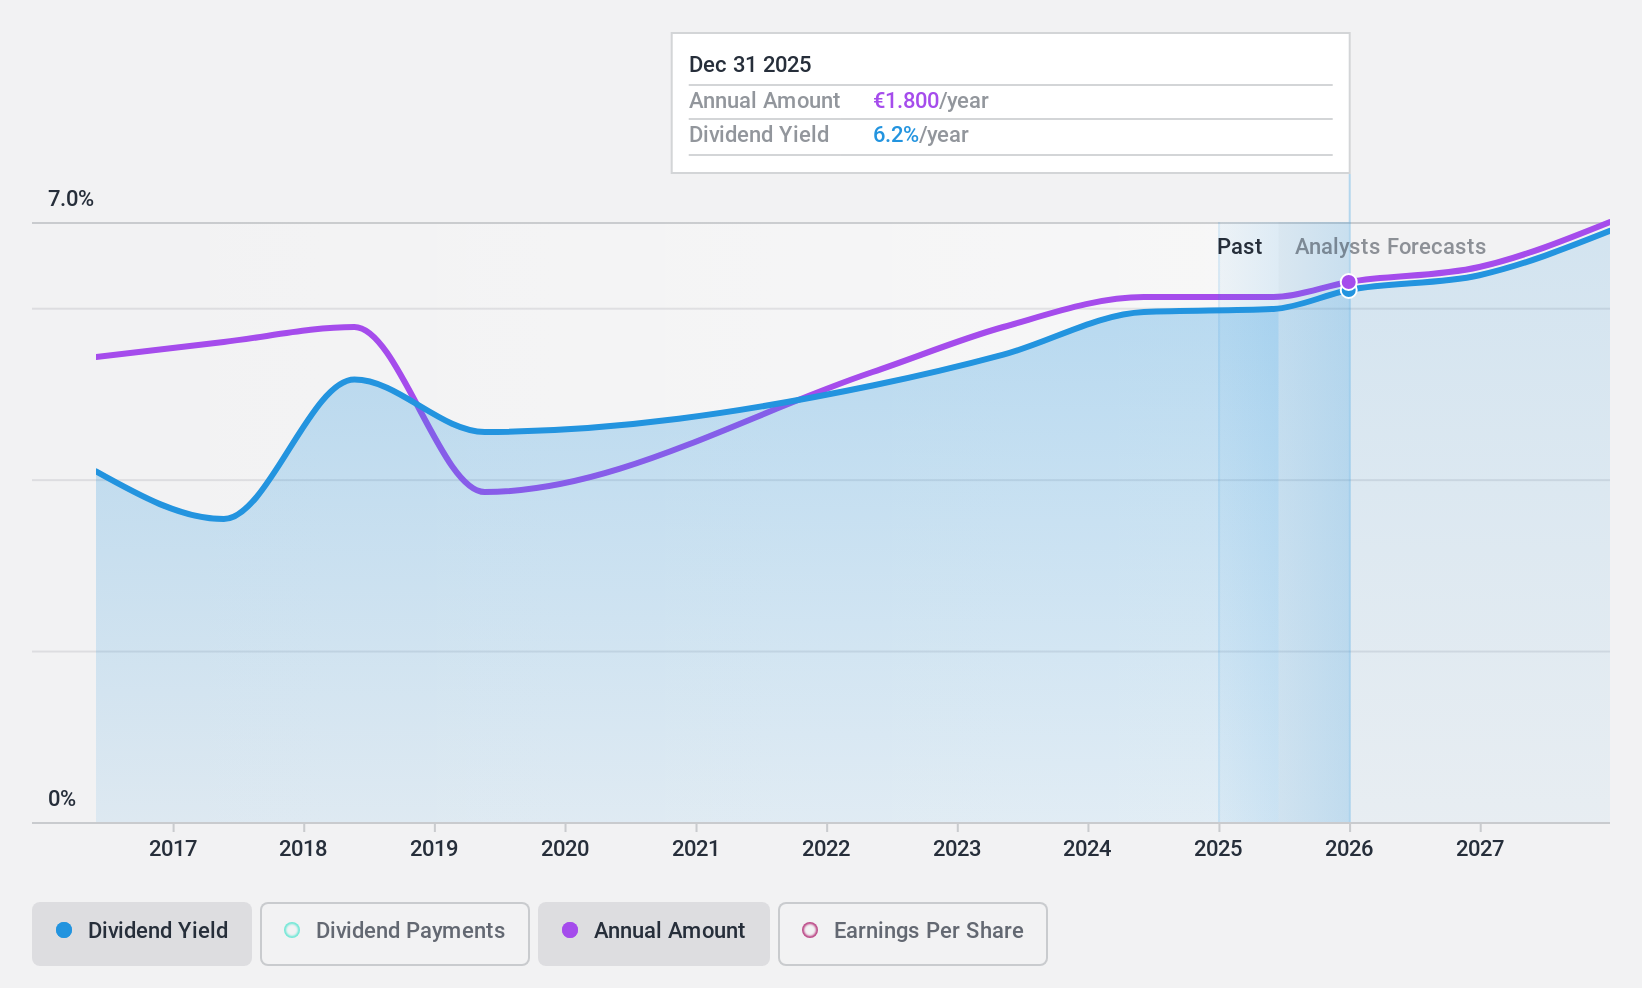
PWO (XTRA:PWO)
Simply Wall St Dividend Rating: ★★★★★☆
Overview: PWO AG is a company that develops, produces, and sells metal components and systems for the mobility industry across Germany, Czechia, Canada, Mexico, Serbia, and China with a market cap of €91.88 million.
Operations: PWO AG generates revenue of €555.57 million from its Auto Parts & Accessories segment.
Dividend Yield: 6%
PWO AG's dividend yield ranks in the top 25% of German dividend payers, with a stable payout ratio of 43.6% and robust cash flow coverage at 13.8%. Despite its attractive valuation, PWO has experienced volatility in its dividend history over the past decade. The company recently affirmed an annual dividend of €1.75 per share for 2025, maintaining previous levels despite a decline in net income to €12.54 million from €16.22 million last year.
- Take a closer look at PWO's potential here in our dividend report.
- The analysis detailed in our PWO valuation report hints at an deflated share price compared to its estimated value.
Seize The Opportunity
- Click here to access our complete index of 247 Top European Dividend Stocks.
- Have you diversified into these companies? Leverage the power of Simply Wall St's portfolio to keep a close eye on market movements affecting your investments.
- Invest smarter with the free Simply Wall St app providing detailed insights into every stock market around the globe.
Ready To Venture Into Other Investment Styles?
- Explore high-performing small cap companies that haven't yet garnered significant analyst attention.
- Fuel your portfolio with companies showing strong growth potential, backed by optimistic outlooks both from analysts and management.
- Find companies with promising cash flow potential yet trading below their fair value.
This article by Simply Wall St is general in nature. We provide commentary based on historical data and analyst forecasts only using an unbiased methodology and our articles are not intended to be financial advice. It does not constitute a recommendation to buy or sell any stock, and does not take account of your objectives, or your financial situation. We aim to bring you long-term focused analysis driven by fundamental data. Note that our analysis may not factor in the latest price-sensitive company announcements or qualitative material. Simply Wall St has no position in any stocks mentioned.
New: AI Stock Screener & Alerts
Our new AI Stock Screener scans the market every day to uncover opportunities.
• Dividend Powerhouses (3%+ Yield)
• Undervalued Small Caps with Insider Buying
• High growth Tech and AI Companies
Or build your own from over 50 metrics.
Have feedback on this article? Concerned about the content? Get in touch with us directly. Alternatively, email editorial-team@simplywallst.com
About BME:FAE
Faes Farma
Researches, develops, produces, and markets pharmaceutical products, healthcare products, and raw materials worldwide.
Excellent balance sheet, good value and pays a dividend.
Similar Companies
Market Insights

Advertisement
Community Narratives
The Next Phase of Energy Storage: How NeoVolta Is Tackling America’s Power Crunch
Fair Value US$7.50|35.2% undervalued
MA
Community Contributor
Why EnSilica is Worth Possibly 13x its Current Price
Fair Value UK£5.00|90.0% undervalued
DO
Community Contributor
M&A Activity, Industry Diversification & A Defense Contract Monopoly Will Push BWXT For Healthy Long-Term Growth
Fair Value US$220.00|15.6% undervalued
CL
Community Contributor
A case for Cassiar Gold Corp (TSXV: GLDC) to reach CAD$8-10 before 2030 (X30-37)
Fair Value CA$10.00|97.1% undervalued
AG
Community Contributor