
Advertisement
- Czech Republic
- /
- Electric Utilities
- /
- SEP:CEZ
CEZ, a. s.'s (SEP:CEZ) Stock Has Shown A Decent Performance: Have Financials A Role To Play?

Most readers would already know that CEZ a. s' (SEP:CEZ) stock increased by 6.0% over the past three months. Given that stock prices are usually aligned with a company's financial performance in the long-term, we decided to investigate if the company's decent financials had a hand to play in the recent price move. Specifically, we decided to study CEZ a. s' ROE in this article.
Return on equity or ROE is an important factor to be considered by a shareholder because it tells them how effectively their capital is being reinvested. In other words, it is a profitability ratio which measures the rate of return on the capital provided by the company's shareholders.
See our latest analysis for CEZ a. s
How To Calculate Return On Equity?
The formula for return on equity is:
Return on Equity = Net Profit (from continuing operations) ÷ Shareholders' Equity
So, based on the above formula, the ROE for CEZ a. s is:
12% = Kč32b ÷ Kč263b (Based on the trailing twelve months to March 2024).
The 'return' refers to a company's earnings over the last year. One way to conceptualize this is that for each CZK1 of shareholders' capital it has, the company made CZK0.12 in profit.
What Is The Relationship Between ROE And Earnings Growth?
So far, we've learned that ROE is a measure of a company's profitability. Based on how much of its profits the company chooses to reinvest or "retain", we are then able to evaluate a company's future ability to generate profits. Assuming everything else remains unchanged, the higher the ROE and profit retention, the higher the growth rate of a company compared to companies that don't necessarily bear these characteristics.
CEZ a. s' Earnings Growth And 12% ROE
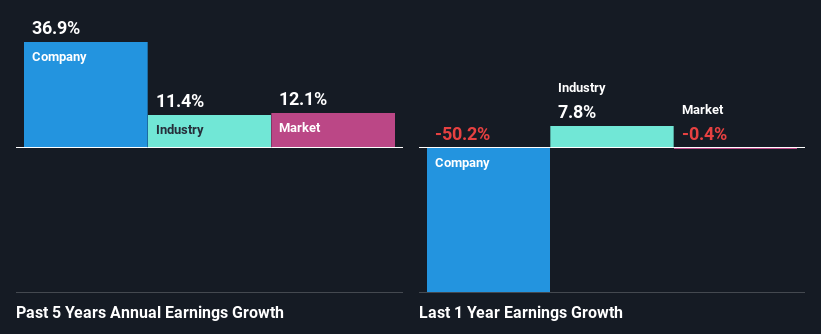
To start with, CEZ a. s' ROE looks acceptable. Further, the company's ROE compares quite favorably to the industry average of 10%. This probably laid the ground for CEZ a. s' significant 37% net income growth seen over the past five years. However, there could also be other causes behind this growth. Such as - high earnings retention or an efficient management in place.
As a next step, we compared CEZ a. s' net income growth with the industry, and pleasingly, we found that the growth seen by the company is higher than the average industry growth of 11%.
The basis for attaching value to a company is, to a great extent, tied to its earnings growth. It’s important for an investor to know whether the market has priced in the company's expected earnings growth (or decline). This then helps them determine if the stock is placed for a bright or bleak future. If you're wondering about CEZ a. s''s valuation, check out this gauge of its price-to-earnings ratio, as compared to its industry.
Is CEZ a. s Making Efficient Use Of Its Profits?
CEZ a. s' significant three-year median payout ratio of 95% (where it is retaining only 5.5% of its income) suggests that the company has been able to achieve a high growth in earnings despite returning most of its income to shareholders.
Moreover, CEZ a. s is determined to keep sharing its profits with shareholders which we infer from its long history of paying a dividend for at least ten years. Upon studying the latest analysts' consensus data, we found that the company is expected to keep paying out approximately 81% of its profits over the next three years. As a result, CEZ a. s' ROE is not expected to change by much either, which we inferred from the analyst estimate of 12% for future ROE.
Summary
In total, it does look like CEZ a. s has some positive aspects to its business. Specifically, its high ROE which likely led to the growth in earnings. Bear in mind, the company reinvests little to none of its profits, which means that investors aren't necessarily reaping the full benefits of the high rate of return. With that said, the latest industry analyst forecasts reveal that the company's earnings growth is expected to slow down. To know more about the latest analysts predictions for the company, check out this visualization of analyst forecasts for the company.
New: AI Stock Screener & Alerts
Our new AI Stock Screener scans the market every day to uncover opportunities.
• Dividend Powerhouses (3%+ Yield)
• Undervalued Small Caps with Insider Buying
• High growth Tech and AI Companies
Or build your own from over 50 metrics.
Have feedback on this article? Concerned about the content? Get in touch with us directly. Alternatively, email editorial-team (at) simplywallst.com.
This article by Simply Wall St is general in nature. We provide commentary based on historical data and analyst forecasts only using an unbiased methodology and our articles are not intended to be financial advice. It does not constitute a recommendation to buy or sell any stock, and does not take account of your objectives, or your financial situation. We aim to bring you long-term focused analysis driven by fundamental data. Note that our analysis may not factor in the latest price-sensitive company announcements or qualitative material. Simply Wall St has no position in any stocks mentioned.
Have feedback on this article? Concerned about the content? Get in touch with us directly. Alternatively, email editorial-team@simplywallst.com
About SEP:CEZ
CEZ a. s
Engages in the generation, distribution, trade, and sale of electricity and heat in Western, Central, and Southeastern Europe.
Average dividend payer with mediocre balance sheet.
Similar Companies
Market Insights


Advertisement
Community Narratives
MicroStrategy: Volatile Gamble or Golden Opportunity?
Fair Value US$663.00|32.0% undervalued
BL
Community Contributor
Emerging Markets and Debt Reduction Will Propel Bath & Body Works Forward
Fair Value US$40.73|21.7% undervalued
ZW
Community Contributor
An amazing opportunity to potentially get a 100 bagger
Fair Value US$10.00|0.5% overvalued
DA
Community Contributor