- China
- /
- Renewable Energy
- /
- SZSE:000791
The five-year decline in earnings for GEPIC Energy Development SZSE:000791) isn't encouraging, but shareholders are still up 83% over that period


Generally speaking the aim of active stock picking is to find companies that provide returns that are superior to the market average. And in our experience, buying the right stocks can give your wealth a significant boost. For example, the GEPIC Energy Development Co., Ltd. (SZSE:000791) share price is up 66% in the last 5 years, clearly besting the market return of around 13% (ignoring dividends). On the other hand, the more recent gains haven't been so impressive, with shareholders gaining just 12%, including dividends.
Although GEPIC Energy Development has shed CN¥752m from its market cap this week, let's take a look at its longer term fundamental trends and see if they've driven returns.
Check out our latest analysis for GEPIC Energy Development
While the efficient markets hypothesis continues to be taught by some, it has been proven that markets are over-reactive dynamic systems, and investors are not always rational. By comparing earnings per share (EPS) and share price changes over time, we can get a feel for how investor attitudes to a company have morphed over time.
During five years of share price growth, GEPIC Energy Development actually saw its EPS drop 2.7% per year.
So it's hard to argue that the earnings per share are the best metric to judge the company, as it may not be optimized for profits at this point. Therefore, it's worth taking a look at other metrics to try to understand the share price movements.
The modest 1.8% dividend yield is unlikely to be propping up the share price. We are not particularly impressed by the annual compound revenue growth of 2.2% over five years. So why is the share price up? It's not immediately obvious to us, but a closer look at the company's progress over time might yield answers.
The company's revenue and earnings (over time) are depicted in the image below (click to see the exact numbers).
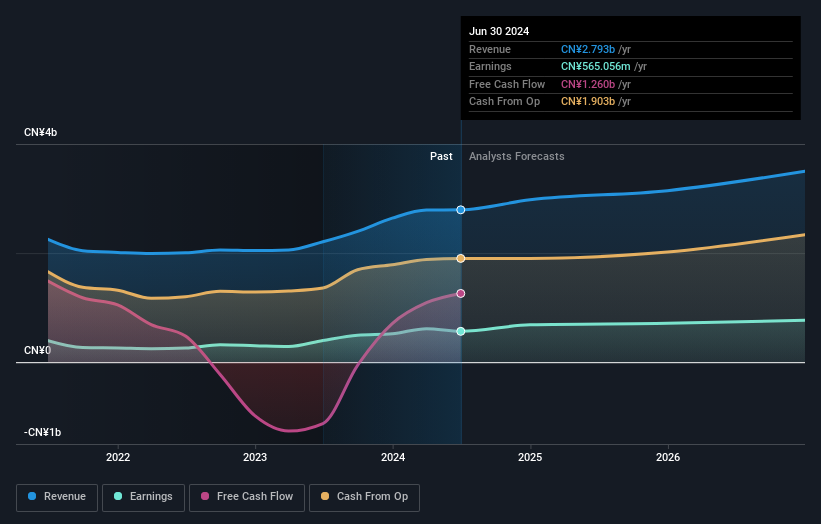
It's probably worth noting that the CEO is paid less than the median at similar sized companies. It's always worth keeping an eye on CEO pay, but a more important question is whether the company will grow earnings throughout the years. So it makes a lot of sense to check out what analysts think GEPIC Energy Development will earn in the future (free profit forecasts).
What About Dividends?
As well as measuring the share price return, investors should also consider the total shareholder return (TSR). Whereas the share price return only reflects the change in the share price, the TSR includes the value of dividends (assuming they were reinvested) and the benefit of any discounted capital raising or spin-off. Arguably, the TSR gives a more comprehensive picture of the return generated by a stock. In the case of GEPIC Energy Development, it has a TSR of 83% for the last 5 years. That exceeds its share price return that we previously mentioned. And there's no prize for guessing that the dividend payments largely explain the divergence!
A Different Perspective
We're pleased to report that GEPIC Energy Development shareholders have received a total shareholder return of 12% over one year. And that does include the dividend. However, that falls short of the 13% TSR per annum it has made for shareholders, each year, over five years. It's always interesting to track share price performance over the longer term. But to understand GEPIC Energy Development better, we need to consider many other factors. Case in point: We've spotted 2 warning signs for GEPIC Energy Development you should be aware of, and 1 of them is a bit concerning.
If you like to buy stocks alongside management, then you might just love this free list of companies. (Hint: many of them are unnoticed AND have attractive valuation).
Please note, the market returns quoted in this article reflect the market weighted average returns of stocks that currently trade on Chinese exchanges.
New: Manage All Your Stock Portfolios in One Place
We've created the ultimate portfolio companion for stock investors, and it's free.
• Connect an unlimited number of Portfolios and see your total in one currency
• Be alerted to new Warning Signs or Risks via email or mobile
• Track the Fair Value of your stocks
Have feedback on this article? Concerned about the content? Get in touch with us directly. Alternatively, email editorial-team (at) simplywallst.com.
This article by Simply Wall St is general in nature. We provide commentary based on historical data and analyst forecasts only using an unbiased methodology and our articles are not intended to be financial advice. It does not constitute a recommendation to buy or sell any stock, and does not take account of your objectives, or your financial situation. We aim to bring you long-term focused analysis driven by fundamental data. Note that our analysis may not factor in the latest price-sensitive company announcements or qualitative material. Simply Wall St has no position in any stocks mentioned.
About SZSE:000791
GEPIC Energy Development
Engages in hydropower, wind power, and photovoltaic power generation business in China.
Proven track record average dividend payer.

