- China
- /
- Renewable Energy
- /
- SZSE:000591
CECEP Solar Energy Co.,Ltd.'s (SZSE:000591) Fundamentals Look Pretty Strong: Could The Market Be Wrong About The Stock?

CECEP Solar EnergyLtd (SZSE:000591) has had a rough three months with its share price down 3.6%. However, the company's fundamentals look pretty decent, and long-term financials are usually aligned with future market price movements. Particularly, we will be paying attention to CECEP Solar EnergyLtd's ROE today.
Return on equity or ROE is an important factor to be considered by a shareholder because it tells them how effectively their capital is being reinvested. In short, ROE shows the profit each dollar generates with respect to its shareholder investments.
See our latest analysis for CECEP Solar EnergyLtd
How To Calculate Return On Equity?
The formula for return on equity is:
Return on Equity = Net Profit (from continuing operations) ÷ Shareholders' Equity
So, based on the above formula, the ROE for CECEP Solar EnergyLtd is:
6.6% = CN¥1.5b ÷ CN¥23b (Based on the trailing twelve months to March 2024).
The 'return' is the profit over the last twelve months. One way to conceptualize this is that for each CN¥1 of shareholders' capital it has, the company made CN¥0.07 in profit.
What Has ROE Got To Do With Earnings Growth?
So far, we've learned that ROE is a measure of a company's profitability. Depending on how much of these profits the company reinvests or "retains", and how effectively it does so, we are then able to assess a company’s earnings growth potential. Generally speaking, other things being equal, firms with a high return on equity and profit retention, have a higher growth rate than firms that don’t share these attributes.
A Side By Side comparison of CECEP Solar EnergyLtd's Earnings Growth And 6.6% ROE
When you first look at it, CECEP Solar EnergyLtd's ROE doesn't look that attractive. Yet, a closer study shows that the company's ROE is similar to the industry average of 7.7%. Even so, CECEP Solar EnergyLtd has shown a fairly decent growth in its net income which grew at a rate of 13%. Given the slightly low ROE, it is likely that there could be some other aspects that are driving this growth. For instance, the company has a low payout ratio or is being managed efficiently.
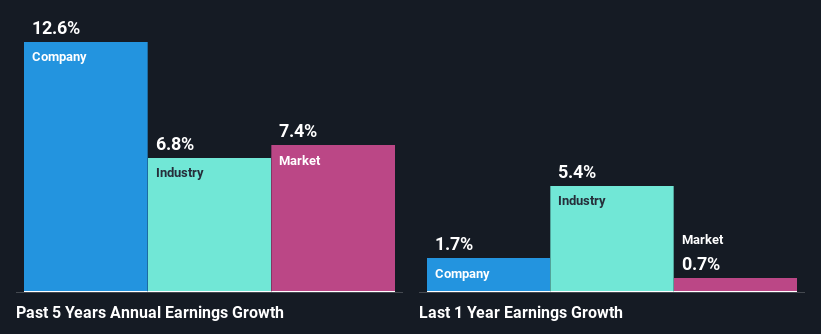
As a next step, we compared CECEP Solar EnergyLtd's net income growth with the industry, and pleasingly, we found that the growth seen by the company is higher than the average industry growth of 6.8%.
The basis for attaching value to a company is, to a great extent, tied to its earnings growth. The investor should try to establish if the expected growth or decline in earnings, whichever the case may be, is priced in. This then helps them determine if the stock is placed for a bright or bleak future. Is CECEP Solar EnergyLtd fairly valued compared to other companies? These 3 valuation measures might help you decide.
Is CECEP Solar EnergyLtd Using Its Retained Earnings Effectively?
CECEP Solar EnergyLtd has a three-year median payout ratio of 32%, which implies that it retains the remaining 68% of its profits. This suggests that its dividend is well covered, and given the decent growth seen by the company, it looks like management is reinvesting its earnings efficiently.
Moreover, CECEP Solar EnergyLtd is determined to keep sharing its profits with shareholders which we infer from its long history of seven years of paying a dividend.
Conclusion
Overall, we feel that CECEP Solar EnergyLtd certainly does have some positive factors to consider. Even in spite of the low rate of return, the company has posted impressive earnings growth as a result of reinvesting heavily into its business. The latest industry analyst forecasts show that the company is expected to maintain its current growth rate. Are these analysts expectations based on the broad expectations for the industry, or on the company's fundamentals? Click here to be taken to our analyst's forecasts page for the company.
Mobile Infrastructure for Defense and Disaster
The next wave in robotics isn't humanoid. Its fully autonomous towers delivering 5G, ISR, and radar in under 30 minutes, anywhere.
Get the investor briefing before the next round of contracts
Sponsored On Behalf of CiTechNew: AI Stock Screener & Alerts
Our new AI Stock Screener scans the market every day to uncover opportunities.
• Dividend Powerhouses (3%+ Yield)
• Undervalued Small Caps with Insider Buying
• High growth Tech and AI Companies
Or build your own from over 50 metrics.
Have feedback on this article? Concerned about the content? Get in touch with us directly. Alternatively, email editorial-team (at) simplywallst.com.
This article by Simply Wall St is general in nature. We provide commentary based on historical data and analyst forecasts only using an unbiased methodology and our articles are not intended to be financial advice. It does not constitute a recommendation to buy or sell any stock, and does not take account of your objectives, or your financial situation. We aim to bring you long-term focused analysis driven by fundamental data. Note that our analysis may not factor in the latest price-sensitive company announcements or qualitative material. Simply Wall St has no position in any stocks mentioned.
About SZSE:000591
CECEP Solar EnergyLtd
Provides solar power generation solutions in China, Europe, the Asia-Pacific, and internationally.
Good value with acceptable track record.
Similar Companies
Market Insights

Weekly Picks

Early mover in a fast growing industry. Likely to experience share price volatility as they scale


A case for CA$31.80 (undiluted), aka 8,616% upside from CA$0.37 (an 86 bagger!).


Moderation and Stabilisation: HOLD: Fair Price based on a 4-year Cycle is $12.08
Recently Updated Narratives


An amazing opportunity to potentially get a 100 bagger

Amazon: Why the World’s Biggest Platform Still Runs on Invisible Economics

Sunrun Stock: When the Energy Transition Collides With the Cost of Capital
Popular Narratives


MicroVision will explode future revenue by 380.37% with a vision towards success


Crazy Undervalued 42 Baggers Silver Play (Active & Running Mine)

