- China
- /
- Other Utilities
- /
- SHSE:600719
Some Dalian Thermal Power Co.,Ltd. (SHSE:600719) Shareholders Look For Exit As Shares Take 33% Pounding

Unfortunately for some shareholders, the Dalian Thermal Power Co.,Ltd. (SHSE:600719) share price has dived 33% in the last thirty days, prolonging recent pain. Instead of being rewarded, shareholders who have already held through the last twelve months are now sitting on a 35% share price drop.
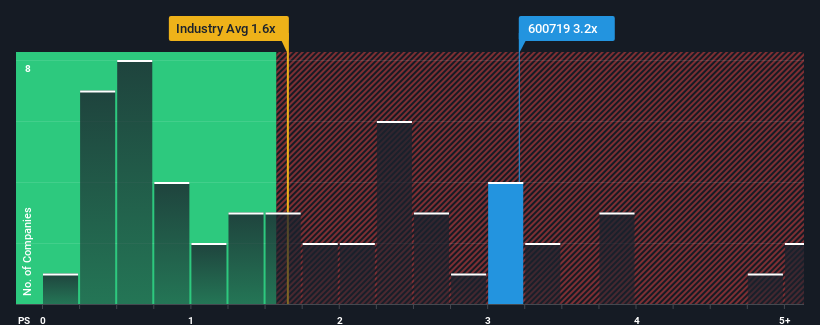
In spite of the heavy fall in price, when almost half of the companies in China's Integrated Utilities industry have price-to-sales ratios (or "P/S") below 2.3x, you may still consider Dalian Thermal PowerLtd as a stock probably not worth researching with its 3.2x P/S ratio. However, the P/S might be high for a reason and it requires further investigation to determine if it's justified.
Check out our latest analysis for Dalian Thermal PowerLtd
What Does Dalian Thermal PowerLtd's P/S Mean For Shareholders?
As an illustration, revenue has deteriorated at Dalian Thermal PowerLtd over the last year, which is not ideal at all. It might be that many expect the company to still outplay most other companies over the coming period, which has kept the P/S from collapsing. However, if this isn't the case, investors might get caught out paying too much for the stock.
Although there are no analyst estimates available for Dalian Thermal PowerLtd, take a look at this free data-rich visualisation to see how the company stacks up on earnings, revenue and cash flow.How Is Dalian Thermal PowerLtd's Revenue Growth Trending?
Dalian Thermal PowerLtd's P/S ratio would be typical for a company that's expected to deliver solid growth, and importantly, perform better than the industry.
Retrospectively, the last year delivered a frustrating 20% decrease to the company's top line. This means it has also seen a slide in revenue over the longer-term as revenue is down 5.3% in total over the last three years. Therefore, it's fair to say the revenue growth recently has been undesirable for the company.
Weighing that medium-term revenue trajectory against the broader industry's one-year forecast for expansion of 5.6% shows it's an unpleasant look.
With this information, we find it concerning that Dalian Thermal PowerLtd is trading at a P/S higher than the industry. Apparently many investors in the company are way more bullish than recent times would indicate and aren't willing to let go of their stock at any price. There's a very good chance existing shareholders are setting themselves up for future disappointment if the P/S falls to levels more in line with the recent negative growth rates.
What We Can Learn From Dalian Thermal PowerLtd's P/S?
There's still some elevation in Dalian Thermal PowerLtd's P/S, even if the same can't be said for its share price recently. Typically, we'd caution against reading too much into price-to-sales ratios when settling on investment decisions, though it can reveal plenty about what other market participants think about the company.
We've established that Dalian Thermal PowerLtd currently trades on a much higher than expected P/S since its recent revenues have been in decline over the medium-term. With a revenue decline on investors' minds, the likelihood of a souring sentiment is quite high which could send the P/S back in line with what we'd expect. If recent medium-term revenue trends continue, it will place shareholders' investments at significant risk and potential investors in danger of paying an excessive premium.
Having said that, be aware Dalian Thermal PowerLtd is showing 3 warning signs in our investment analysis, you should know about.
Of course, profitable companies with a history of great earnings growth are generally safer bets. So you may wish to see this free collection of other companies that have reasonable P/E ratios and have grown earnings strongly.
New: Manage All Your Stock Portfolios in One Place
We've created the ultimate portfolio companion for stock investors, and it's free.
• Connect an unlimited number of Portfolios and see your total in one currency
• Be alerted to new Warning Signs or Risks via email or mobile
• Track the Fair Value of your stocks
Have feedback on this article? Concerned about the content? Get in touch with us directly. Alternatively, email editorial-team (at) simplywallst.com.
This article by Simply Wall St is general in nature. We provide commentary based on historical data and analyst forecasts only using an unbiased methodology and our articles are not intended to be financial advice. It does not constitute a recommendation to buy or sell any stock, and does not take account of your objectives, or your financial situation. We aim to bring you long-term focused analysis driven by fundamental data. Note that our analysis may not factor in the latest price-sensitive company announcements or qualitative material. Simply Wall St has no position in any stocks mentioned.
About SHSE:600719
Dalian Thermal PowerLtd
Engages in the cogeneration and central heating business in China.
Very low with weak fundamentals.
Market Insights

Community Narratives
