Milkyway Chemical Supply Chain Service Co.,Ltd (SHSE:603713) Stock Rockets 34% But Many Are Still Ignoring The Company


Milkyway Chemical Supply Chain Service Co.,Ltd (SHSE:603713) shareholders would be excited to see that the share price has had a great month, posting a 34% gain and recovering from prior weakness. Not all shareholders will be feeling jubilant, since the share price is still down a very disappointing 19% in the last twelve months.
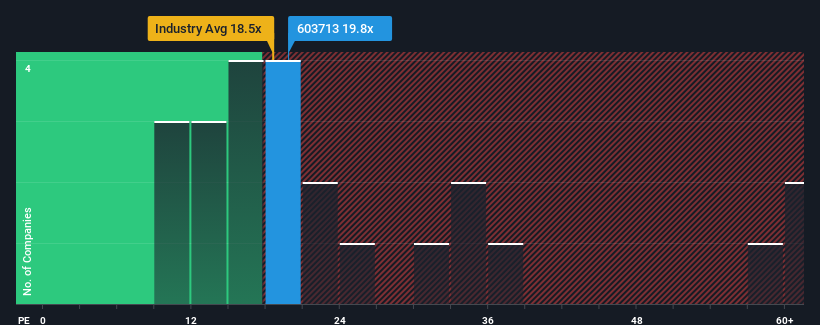
In spite of the firm bounce in price, Milkyway Chemical Supply Chain ServiceLtd's price-to-earnings (or "P/E") ratio of 19.8x might still make it look like a buy right now compared to the market in China, where around half of the companies have P/E ratios above 30x and even P/E's above 58x are quite common. Nonetheless, we'd need to dig a little deeper to determine if there is a rational basis for the reduced P/E.
Recent times haven't been advantageous for Milkyway Chemical Supply Chain ServiceLtd as its earnings have been falling quicker than most other companies. It seems that many are expecting the dismal earnings performance to persist, which has repressed the P/E. You'd much rather the company wasn't bleeding earnings if you still believe in the business. If not, then existing shareholders will probably struggle to get excited about the future direction of the share price.
Check out our latest analysis for Milkyway Chemical Supply Chain ServiceLtd
Does Growth Match The Low P/E?
There's an inherent assumption that a company should underperform the market for P/E ratios like Milkyway Chemical Supply Chain ServiceLtd's to be considered reasonable.
If we review the last year of earnings, dishearteningly the company's profits fell to the tune of 12%. However, a few very strong years before that means that it was still able to grow EPS by an impressive 43% in total over the last three years. So we can start by confirming that the company has generally done a very good job of growing earnings over that time, even though it had some hiccups along the way.
Turning to the outlook, the next three years should generate growth of 19% per year as estimated by the seven analysts watching the company. With the market predicted to deliver 19% growth per year, the company is positioned for a comparable earnings result.
In light of this, it's peculiar that Milkyway Chemical Supply Chain ServiceLtd's P/E sits below the majority of other companies. Apparently some shareholders are doubtful of the forecasts and have been accepting lower selling prices.
What We Can Learn From Milkyway Chemical Supply Chain ServiceLtd's P/E?
Milkyway Chemical Supply Chain ServiceLtd's stock might have been given a solid boost, but its P/E certainly hasn't reached any great heights. We'd say the price-to-earnings ratio's power isn't primarily as a valuation instrument but rather to gauge current investor sentiment and future expectations.
We've established that Milkyway Chemical Supply Chain ServiceLtd currently trades on a lower than expected P/E since its forecast growth is in line with the wider market. When we see an average earnings outlook with market-like growth, we assume potential risks are what might be placing pressure on the P/E ratio. It appears some are indeed anticipating earnings instability, because these conditions should normally provide more support to the share price.
Don't forget that there may be other risks. For instance, we've identified 2 warning signs for Milkyway Chemical Supply Chain ServiceLtd (1 can't be ignored) you should be aware of.
If you're unsure about the strength of Milkyway Chemical Supply Chain ServiceLtd's business, why not explore our interactive list of stocks with solid business fundamentals for some other companies you may have missed.
New: Manage All Your Stock Portfolios in One Place
We've created the ultimate portfolio companion for stock investors, and it's free.
• Connect an unlimited number of Portfolios and see your total in one currency
• Be alerted to new Warning Signs or Risks via email or mobile
• Track the Fair Value of your stocks
Have feedback on this article? Concerned about the content? Get in touch with us directly. Alternatively, email editorial-team (at) simplywallst.com.
This article by Simply Wall St is general in nature. We provide commentary based on historical data and analyst forecasts only using an unbiased methodology and our articles are not intended to be financial advice. It does not constitute a recommendation to buy or sell any stock, and does not take account of your objectives, or your financial situation. We aim to bring you long-term focused analysis driven by fundamental data. Note that our analysis may not factor in the latest price-sensitive company announcements or qualitative material. Simply Wall St has no position in any stocks mentioned.
About SHSE:603713
Milkyway Chemical Supply Chain ServiceLtd
Provides chemical supply chain solutions in China and internationally.
Very undervalued with solid track record.
Market Insights

Community Narratives


