
Advertisement
- China
- /
- Electronic Equipment and Components
- /
- SZSE:300647
Shenzhen Fluence Technology PLC.'s (SZSE:300647) Shares Climb 27% But Its Business Is Yet to Catch Up
Shenzhen Fluence Technology PLC. (SZSE:300647) shareholders would be excited to see that the share price has had a great month, posting a 27% gain and recovering from prior weakness. Not all shareholders will be feeling jubilant, since the share price is still down a very disappointing 16% in the last twelve months.
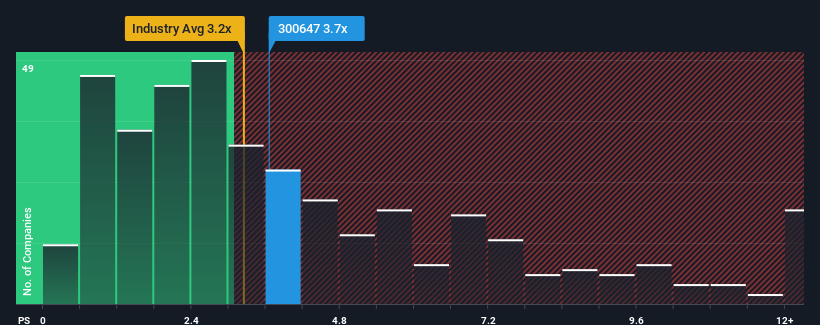
In spite of the firm bounce in price, it's still not a stretch to say that Shenzhen Fluence Technology's price-to-sales (or "P/S") ratio of 3.7x right now seems quite "middle-of-the-road" compared to the Electronic industry in China, where the median P/S ratio is around 3.2x. Although, it's not wise to simply ignore the P/S without explanation as investors may be disregarding a distinct opportunity or a costly mistake.
Check out our latest analysis for Shenzhen Fluence Technology
What Does Shenzhen Fluence Technology's P/S Mean For Shareholders?
As an illustration, revenue has deteriorated at Shenzhen Fluence Technology over the last year, which is not ideal at all. Perhaps investors believe the recent revenue performance is enough to keep in line with the industry, which is keeping the P/S from dropping off. If not, then existing shareholders may be a little nervous about the viability of the share price.
Although there are no analyst estimates available for Shenzhen Fluence Technology, take a look at this free data-rich visualisation to see how the company stacks up on earnings, revenue and cash flow.Do Revenue Forecasts Match The P/S Ratio?
The only time you'd be comfortable seeing a P/S like Shenzhen Fluence Technology's is when the company's growth is tracking the industry closely.
In reviewing the last year of financials, we were disheartened to see the company's revenues fell to the tune of 25%. That put a dampener on the good run it was having over the longer-term as its three-year revenue growth is still a noteworthy 12% in total. Accordingly, while they would have preferred to keep the run going, shareholders would be roughly satisfied with the medium-term rates of revenue growth.
Comparing that to the industry, which is predicted to deliver 25% growth in the next 12 months, the company's momentum is weaker, based on recent medium-term annualised revenue results.
In light of this, it's curious that Shenzhen Fluence Technology's P/S sits in line with the majority of other companies. It seems most investors are ignoring the fairly limited recent growth rates and are willing to pay up for exposure to the stock. Maintaining these prices will be difficult to achieve as a continuation of recent revenue trends is likely to weigh down the shares eventually.
What We Can Learn From Shenzhen Fluence Technology's P/S?
Shenzhen Fluence Technology appears to be back in favour with a solid price jump bringing its P/S back in line with other companies in the industry It's argued the price-to-sales ratio is an inferior measure of value within certain industries, but it can be a powerful business sentiment indicator.
Our examination of Shenzhen Fluence Technology revealed its poor three-year revenue trends aren't resulting in a lower P/S as per our expectations, given they look worse than current industry outlook. When we see weak revenue with slower than industry growth, we suspect the share price is at risk of declining, bringing the P/S back in line with expectations. Unless there is a significant improvement in the company's medium-term performance, it will be difficult to prevent the P/S ratio from declining to a more reasonable level.
Plus, you should also learn about these 3 warning signs we've spotted with Shenzhen Fluence Technology (including 2 which can't be ignored).
If strong companies turning a profit tickle your fancy, then you'll want to check out this free list of interesting companies that trade on a low P/E (but have proven they can grow earnings).
New: Manage All Your Stock Portfolios in One Place
We've created the ultimate portfolio companion for stock investors, and it's free.
• Connect an unlimited number of Portfolios and see your total in one currency
• Be alerted to new Warning Signs or Risks via email or mobile
• Track the Fair Value of your stocks
Have feedback on this article? Concerned about the content? Get in touch with us directly. Alternatively, email editorial-team (at) simplywallst.com.
This article by Simply Wall St is general in nature. We provide commentary based on historical data and analyst forecasts only using an unbiased methodology and our articles are not intended to be financial advice. It does not constitute a recommendation to buy or sell any stock, and does not take account of your objectives, or your financial situation. We aim to bring you long-term focused analysis driven by fundamental data. Note that our analysis may not factor in the latest price-sensitive company announcements or qualitative material. Simply Wall St has no position in any stocks mentioned.
About SZSE:300647
Shenzhen Fluence Technology
Engages in research and development, production, and sale of lithium battery cathode material and cooling products in China and internationally.
Mediocre balance sheet and slightly overvalued.
Market Insights

Advertisement
Weekly Picks
WO

woodworthfund on MGP Ingredients ·
THE KINGDOM OF BROWN GOODS: WHY MGPI IS BEING CRUSHED BY INVENTORY & PRIMED FOR RESURRECTION
Fair Value:US$4039.0% undervalued
9 followersusers have followed this narrative
0 commentsusers have commented on this narrative
3 likesusers have liked this narrative
DO


Double_Bubbler on Vertical Aerospace ·
Why Vertical Aerospace (NYSE: EVTL) is Worth Possibly Over 13x its Current Price
Fair Value:US$6087.9% undervalued
15 followersusers have followed this narrative
1 commentusers have commented on this narrative
11 likesusers have liked this narrative
TI


TickerTickle on Oracle ·
The Quiet Giant That Became AI’s Power Grid
Fair Value:US$389.8143.2% undervalued
29 followersusers have followed this narrative
2 commentsusers have commented on this narrative
6 likesusers have liked this narrative
Recently Updated Narratives
LE

lexdrew1 on GE Vernova ·
GE Vernova revenue will grow by 13% with a future PE of 64.7x
Fair Value:US$824.5724.2% undervalued
4 followersusers have followed this narrative
0 commentsusers have commented on this narrative
0 likesusers have liked this narrative
GI

Gil263 on Butterfly Network ·
A buy recommendation
Fair Value:US$1.872.2% overvalued
1 followerusers have followed this narrative
1 commentusers have commented on this narrative
0 likesusers have liked this narrative
OP

OpenHorizons on Channel Vas Investments ·
Growing between 25-50% for the next 3-5 years
Fair Value:R12.1161.5% overvalued
1 followerusers have followed this narrative
0 commentsusers have commented on this narrative
0 likesusers have liked this narrative
Popular Narratives
TH


TheWallstreetKing on MicroVision ·
MicroVision will explode future revenue by 380.37% with a vision towards success
Fair Value:US$6098.4% undervalued
118 followersusers have followed this narrative
11 commentsusers have commented on this narrative
22 likesusers have liked this narrative
AN


AnalystConsensusTarget on NVIDIA ·
NVDA: Expanding AI Demand Will Drive Major Data Center Investments Through 2026
Fair Value:US$250.3926.1% undervalued
963 followersusers have followed this narrative
6 commentsusers have commented on this narrative
25 likesusers have liked this narrative
RO


RockeTeller on Santacruz Silver Mining ·
Crazy Undervalued 42 Baggers Silver Play (Active & Running Mine)
Fair Value:CA$8685.8% undervalued
76 followersusers have followed this narrative
8 commentsusers have commented on this narrative
21 likesusers have liked this narrative
