
Advertisement
- China
- /
- Electronic Equipment and Components
- /
- SZSE:300130
Should Weakness in XGD Inc.'s (SZSE:300130) Stock Be Seen As A Sign That Market Will Correct The Share Price Given Decent Financials?
It is hard to get excited after looking at XGD's (SZSE:300130) recent performance, when its stock has declined 22% over the past three months. However, stock prices are usually driven by a company’s financials over the long term, which in this case look pretty respectable. Particularly, we will be paying attention to XGD's ROE today.
Return on Equity or ROE is a test of how effectively a company is growing its value and managing investors’ money. Simply put, it is used to assess the profitability of a company in relation to its equity capital.
Check out our latest analysis for XGD
How To Calculate Return On Equity?
ROE can be calculated by using the formula:
Return on Equity = Net Profit (from continuing operations) ÷ Shareholders' Equity
So, based on the above formula, the ROE for XGD is:
19% = CN¥842m ÷ CN¥4.5b (Based on the trailing twelve months to March 2024).
The 'return' is the yearly profit. So, this means that for every CN¥1 of its shareholder's investments, the company generates a profit of CN¥0.19.
What Has ROE Got To Do With Earnings Growth?
Thus far, we have learned that ROE measures how efficiently a company is generating its profits. We now need to evaluate how much profit the company reinvests or "retains" for future growth which then gives us an idea about the growth potential of the company. Assuming all else is equal, companies that have both a higher return on equity and higher profit retention are usually the ones that have a higher growth rate when compared to companies that don't have the same features.
XGD's Earnings Growth And 19% ROE
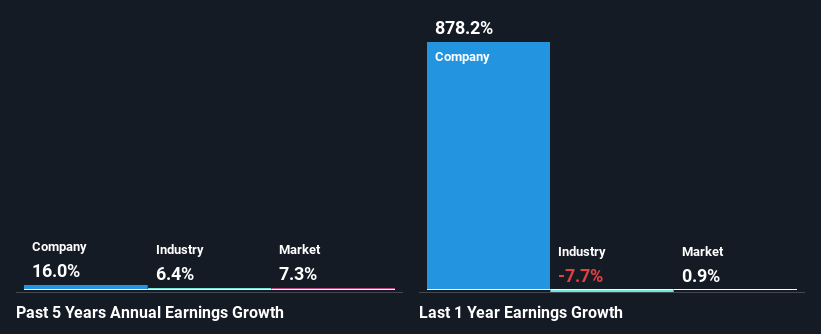
To start with, XGD's ROE looks acceptable. On comparing with the average industry ROE of 6.3% the company's ROE looks pretty remarkable. Probably as a result of this, XGD was able to see a decent growth of 16% over the last five years.
As a next step, we compared XGD's net income growth with the industry, and pleasingly, we found that the growth seen by the company is higher than the average industry growth of 6.4%.
The basis for attaching value to a company is, to a great extent, tied to its earnings growth. It’s important for an investor to know whether the market has priced in the company's expected earnings growth (or decline). Doing so will help them establish if the stock's future looks promising or ominous. One good indicator of expected earnings growth is the P/E ratio which determines the price the market is willing to pay for a stock based on its earnings prospects. So, you may want to check if XGD is trading on a high P/E or a low P/E, relative to its industry.
Is XGD Efficiently Re-investing Its Profits?
XGD's high three-year median payout ratio of 125% suggests that the company is paying out more to its shareholders than what it is making. However, this hasn't really hampered its ability to grow as we saw earlier. It would still be worth keeping an eye on that high payout ratio, if for some reason the company runs into problems and business deteriorates. Our risks dashboard should have the 2 risks we have identified for XGD.
Additionally, XGD has paid dividends over a period of at least ten years which means that the company is pretty serious about sharing its profits with shareholders.
Conclusion
On the whole, we do feel that XGD has some positive attributes. Namely, its high earnings growth, which was likely due to its high ROE. However, investors could have benefitted even more from the high ROE, had the company been reinvesting more of its earnings. As discussed earlier, the company is retaining hardly any of its profits. On studying current analyst estimates, we found that analysts expect the company to continue its recent growth streak. To know more about the company's future earnings growth forecasts take a look at this free report on analyst forecasts for the company to find out more.
New: AI Stock Screener & Alerts
Our new AI Stock Screener scans the market every day to uncover opportunities.
• Dividend Powerhouses (3%+ Yield)
• Undervalued Small Caps with Insider Buying
• High growth Tech and AI Companies
Or build your own from over 50 metrics.
Have feedback on this article? Concerned about the content? Get in touch with us directly. Alternatively, email editorial-team (at) simplywallst.com.
This article by Simply Wall St is general in nature. We provide commentary based on historical data and analyst forecasts only using an unbiased methodology and our articles are not intended to be financial advice. It does not constitute a recommendation to buy or sell any stock, and does not take account of your objectives, or your financial situation. We aim to bring you long-term focused analysis driven by fundamental data. Note that our analysis may not factor in the latest price-sensitive company announcements or qualitative material. Simply Wall St has no position in any stocks mentioned.
About SZSE:300130
XGD
Researches, develops, manufactures, sells, and services payment terminals in China and internationally.
Flawless balance sheet average dividend payer.
Similar Companies
Market Insights

Advertisement
Community Narratives
Finding The True Value Of A Logistics Powerhouse
Fair Value US$95.21|8.7% undervalued
NV
Community Contributor
Paradigm Biopharmaceuticals Will Lead Osteoarthritis Treatment with Zilosul's FDA Success
Fair Value AU$5.50|93.3% undervalued
AM
Community Contributor
Barrick Mining (ABX:CA): A Gold Hedge against a U.S. Shutdown
Fair Value CA$60.00|18.7% undervalued
GM
Community Contributor