- China
- /
- Electronic Equipment and Components
- /
- SZSE:002241
Calculating The Fair Value Of Goertek Inc. (SZSE:002241)

Key Insights
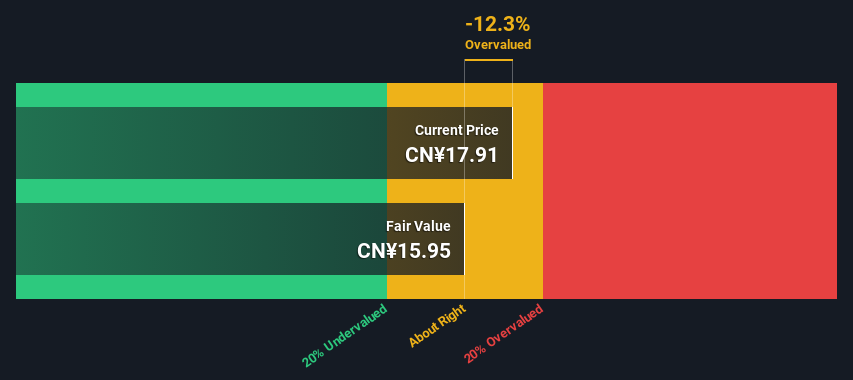
- Goertek's estimated fair value is CN¥15.95 based on 2 Stage Free Cash Flow to Equity
- Current share price of CN¥17.91 suggests Goertek is potentially trading close to its fair value
- Analyst price target for 2241 is CN¥18.01, which is 13% above our fair value estimate
Today we will run through one way of estimating the intrinsic value of Goertek Inc. (SZSE:002241) by projecting its future cash flows and then discounting them to today's value. This will be done using the Discounted Cash Flow (DCF) model. It may sound complicated, but actually it is quite simple!
Companies can be valued in a lot of ways, so we would point out that a DCF is not perfect for every situation. If you still have some burning questions about this type of valuation, take a look at the Simply Wall St analysis model.
Check out our latest analysis for Goertek
Step By Step Through The Calculation
We are going to use a two-stage DCF model, which, as the name states, takes into account two stages of growth. The first stage is generally a higher growth period which levels off heading towards the terminal value, captured in the second 'steady growth' period. To begin with, we have to get estimates of the next ten years of cash flows. Where possible we use analyst estimates, but when these aren't available we extrapolate the previous free cash flow (FCF) from the last estimate or reported value. We assume companies with shrinking free cash flow will slow their rate of shrinkage, and that companies with growing free cash flow will see their growth rate slow, over this period. We do this to reflect that growth tends to slow more in the early years than it does in later years.
A DCF is all about the idea that a dollar in the future is less valuable than a dollar today, so we discount the value of these future cash flows to their estimated value in today's dollars:
10-year free cash flow (FCF) forecast
| 2024 | 2025 | 2026 | 2027 | 2028 | 2029 | 2030 | 2031 | 2032 | 2033 | |
| Levered FCF (CN¥, Millions) | CN¥1.19b | CN¥2.17b | CN¥2.88b | CN¥3.42b | CN¥3.91b | CN¥4.33b | CN¥4.70b | CN¥5.02b | CN¥5.30b | CN¥5.56b |
| Growth Rate Estimate Source | Analyst x6 | Analyst x6 | Analyst x1 | Est @ 19.04% | Est @ 14.21% | Est @ 10.83% | Est @ 8.46% | Est @ 6.81% | Est @ 5.65% | Est @ 4.83% |
| Present Value (CN¥, Millions) Discounted @ 9.8% | CN¥1.1k | CN¥1.8k | CN¥2.2k | CN¥2.4k | CN¥2.4k | CN¥2.5k | CN¥2.4k | CN¥2.4k | CN¥2.3k | CN¥2.2k |
("Est" = FCF growth rate estimated by Simply Wall St)
Present Value of 10-year Cash Flow (PVCF) = CN¥22b
After calculating the present value of future cash flows in the initial 10-year period, we need to calculate the Terminal Value, which accounts for all future cash flows beyond the first stage. The Gordon Growth formula is used to calculate Terminal Value at a future annual growth rate equal to the 5-year average of the 10-year government bond yield of 2.9%. We discount the terminal cash flows to today's value at a cost of equity of 9.8%.
Terminal Value (TV)= FCF2033 × (1 + g) ÷ (r – g) = CN¥5.6b× (1 + 2.9%) ÷ (9.8%– 2.9%) = CN¥83b
Present Value of Terminal Value (PVTV)= TV / (1 + r)10= CN¥83b÷ ( 1 + 9.8%)10= CN¥33b
The total value, or equity value, is then the sum of the present value of the future cash flows, which in this case is CN¥54b. The last step is to then divide the equity value by the number of shares outstanding. Compared to the current share price of CN¥17.9, the company appears around fair value at the time of writing. Remember though, that this is just an approximate valuation, and like any complex formula - garbage in, garbage out.
The Assumptions
Now the most important inputs to a discounted cash flow are the discount rate, and of course, the actual cash flows. If you don't agree with these result, have a go at the calculation yourself and play with the assumptions. The DCF also does not consider the possible cyclicality of an industry, or a company's future capital requirements, so it does not give a full picture of a company's potential performance. Given that we are looking at Goertek as potential shareholders, the cost of equity is used as the discount rate, rather than the cost of capital (or weighted average cost of capital, WACC) which accounts for debt. In this calculation we've used 9.8%, which is based on a levered beta of 1.221. Beta is a measure of a stock's volatility, compared to the market as a whole. We get our beta from the industry average beta of globally comparable companies, with an imposed limit between 0.8 and 2.0, which is a reasonable range for a stable business.
SWOT Analysis for Goertek
- Debt is not viewed as a risk.
- Dividend is low compared to the top 25% of dividend payers in the Electronic market.
- Expected to breakeven next year.
- Has sufficient cash runway for more than 3 years based on current free cash flows.
- Good value based on P/S ratio compared to estimated Fair P/S ratio.
- Paying a dividend but company is unprofitable.
Looking Ahead:
Although the valuation of a company is important, it ideally won't be the sole piece of analysis you scrutinize for a company. DCF models are not the be-all and end-all of investment valuation. Instead the best use for a DCF model is to test certain assumptions and theories to see if they would lead to the company being undervalued or overvalued. If a company grows at a different rate, or if its cost of equity or risk free rate changes sharply, the output can look very different. For Goertek, there are three essential aspects you should further research:
- Financial Health: Does 002241 have a healthy balance sheet? Take a look at our free balance sheet analysis with six simple checks on key factors like leverage and risk.
- Future Earnings: How does 002241's growth rate compare to its peers and the wider market? Dig deeper into the analyst consensus number for the upcoming years by interacting with our free analyst growth expectation chart.
- Other Solid Businesses: Low debt, high returns on equity and good past performance are fundamental to a strong business. Why not explore our interactive list of stocks with solid business fundamentals to see if there are other companies you may not have considered!
PS. The Simply Wall St app conducts a discounted cash flow valuation for every stock on the SZSE every day. If you want to find the calculation for other stocks just search here.
New: Manage All Your Stock Portfolios in One Place
We've created the ultimate portfolio companion for stock investors, and it's free.
• Connect an unlimited number of Portfolios and see your total in one currency
• Be alerted to new Warning Signs or Risks via email or mobile
• Track the Fair Value of your stocks
Have feedback on this article? Concerned about the content? Get in touch with us directly. Alternatively, email editorial-team (at) simplywallst.com.
This article by Simply Wall St is general in nature. We provide commentary based on historical data and analyst forecasts only using an unbiased methodology and our articles are not intended to be financial advice. It does not constitute a recommendation to buy or sell any stock, and does not take account of your objectives, or your financial situation. We aim to bring you long-term focused analysis driven by fundamental data. Note that our analysis may not factor in the latest price-sensitive company announcements or qualitative material. Simply Wall St has no position in any stocks mentioned.
About SZSE:002241
Goertek
Provides micro electro-acoustic components, optical components, electronic accessories, and related products worldwide.
Excellent balance sheet average dividend payer.

