- China
- /
- Electronic Equipment and Components
- /
- SHSE:688020
Market Participants Recognise Guangzhou Fangbang Electronics Co.,Ltd's (SHSE:688020) Revenues Pushing Shares 31% Higher

Those holding Guangzhou Fangbang Electronics Co.,Ltd (SHSE:688020) shares would be relieved that the share price has rebounded 31% in the last thirty days, but it needs to keep going to repair the recent damage it has caused to investor portfolios. Still, the 30-day jump doesn't change the fact that longer term shareholders have seen their stock decimated by the 56% share price drop in the last twelve months.
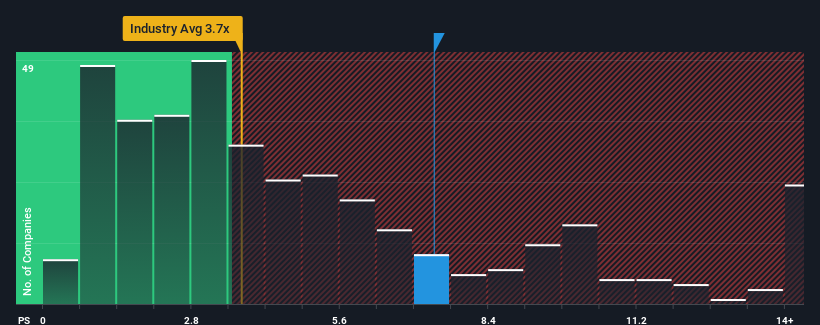
Since its price has surged higher, given around half the companies in China's Electronic industry have price-to-sales ratios (or "P/S") below 3.7x, you may consider Guangzhou Fangbang ElectronicsLtd as a stock to avoid entirely with its 7.4x P/S ratio. Nonetheless, we'd need to dig a little deeper to determine if there is a rational basis for the highly elevated P/S.
Check out our latest analysis for Guangzhou Fangbang ElectronicsLtd

How Guangzhou Fangbang ElectronicsLtd Has Been Performing
With revenue growth that's superior to most other companies of late, Guangzhou Fangbang ElectronicsLtd has been doing relatively well. The P/S is probably high because investors think this strong revenue performance will continue. If not, then existing shareholders might be a little nervous about the viability of the share price.
If you'd like to see what analysts are forecasting going forward, you should check out our free report on Guangzhou Fangbang ElectronicsLtd.What Are Revenue Growth Metrics Telling Us About The High P/S?
There's an inherent assumption that a company should far outperform the industry for P/S ratios like Guangzhou Fangbang ElectronicsLtd's to be considered reasonable.
Taking a look back first, we see that the company managed to grow revenues by a handy 10% last year. The solid recent performance means it was also able to grow revenue by 20% in total over the last three years. Therefore, it's fair to say the revenue growth recently has been respectable for the company.
Turning to the outlook, the next year should generate growth of 78% as estimated by the only analyst watching the company. Meanwhile, the rest of the industry is forecast to only expand by 25%, which is noticeably less attractive.
With this information, we can see why Guangzhou Fangbang ElectronicsLtd is trading at such a high P/S compared to the industry. It seems most investors are expecting this strong future growth and are willing to pay more for the stock.
The Final Word
The strong share price surge has lead to Guangzhou Fangbang ElectronicsLtd's P/S soaring as well. It's argued the price-to-sales ratio is an inferior measure of value within certain industries, but it can be a powerful business sentiment indicator.
As we suspected, our examination of Guangzhou Fangbang ElectronicsLtd's analyst forecasts revealed that its superior revenue outlook is contributing to its high P/S. Right now shareholders are comfortable with the P/S as they are quite confident future revenues aren't under threat. Unless these conditions change, they will continue to provide strong support to the share price.
Having said that, be aware Guangzhou Fangbang ElectronicsLtd is showing 1 warning sign in our investment analysis, you should know about.
If companies with solid past earnings growth is up your alley, you may wish to see this free collection of other companies with strong earnings growth and low P/E ratios.
New: Manage All Your Stock Portfolios in One Place
We've created the ultimate portfolio companion for stock investors, and it's free.
• Connect an unlimited number of Portfolios and see your total in one currency
• Be alerted to new Warning Signs or Risks via email or mobile
• Track the Fair Value of your stocks
Have feedback on this article? Concerned about the content? Get in touch with us directly. Alternatively, email editorial-team (at) simplywallst.com.
This article by Simply Wall St is general in nature. We provide commentary based on historical data and analyst forecasts only using an unbiased methodology and our articles are not intended to be financial advice. It does not constitute a recommendation to buy or sell any stock, and does not take account of your objectives, or your financial situation. We aim to bring you long-term focused analysis driven by fundamental data. Note that our analysis may not factor in the latest price-sensitive company announcements or qualitative material. Simply Wall St has no position in any stocks mentioned.
About SHSE:688020
Guangzhou Fangbang ElectronicsLtd
Guangzhou Fangbang Electronics Co., Ltd engages in the research and development, production, sale, and service of electronic materials in China.
Mediocre balance sheet very low.


