
Advertisement
Revenues Not Telling The Story For Doushen (Beijing) Education & Technology INC. (SZSE:300010) After Shares Rise 28%

Despite an already strong run, Doushen (Beijing) Education & Technology INC. (SZSE:300010) shares have been powering on, with a gain of 28% in the last thirty days. The last 30 days bring the annual gain to a very sharp 73%.
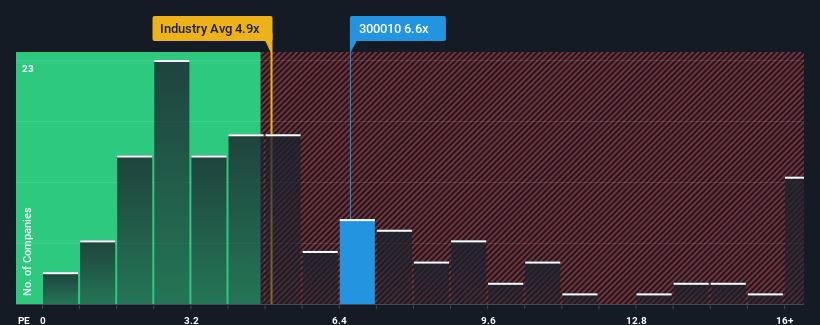
After such a large jump in price, when almost half of the companies in China's Software industry have price-to-sales ratios (or "P/S") below 4.9x, you may consider Doushen (Beijing) Education & Technology as a stock probably not worth researching with its 6.6x P/S ratio. However, the P/S might be high for a reason and it requires further investigation to determine if it's justified.
See our latest analysis for Doushen (Beijing) Education & Technology
What Does Doushen (Beijing) Education & Technology's P/S Mean For Shareholders?
Revenue has risen at a steady rate over the last year for Doushen (Beijing) Education & Technology, which is generally not a bad outcome. One possibility is that the P/S ratio is high because investors think this good revenue growth will be enough to outperform the broader industry in the near future. However, if this isn't the case, investors might get caught out paying too much for the stock.
Want the full picture on earnings, revenue and cash flow for the company? Then our free report on Doushen (Beijing) Education & Technology will help you shine a light on its historical performance.What Are Revenue Growth Metrics Telling Us About The High P/S?
In order to justify its P/S ratio, Doushen (Beijing) Education & Technology would need to produce impressive growth in excess of the industry.
If we review the last year of revenue growth, the company posted a worthy increase of 2.5%. However, this wasn't enough as the latest three year period has seen an unpleasant 31% overall drop in revenue. Accordingly, shareholders would have felt downbeat about the medium-term rates of revenue growth.
Comparing that to the industry, which is predicted to deliver 31% growth in the next 12 months, the company's downward momentum based on recent medium-term revenue results is a sobering picture.
In light of this, it's alarming that Doushen (Beijing) Education & Technology's P/S sits above the majority of other companies. It seems most investors are ignoring the recent poor growth rate and are hoping for a turnaround in the company's business prospects. Only the boldest would assume these prices are sustainable as a continuation of recent revenue trends is likely to weigh heavily on the share price eventually.
What Does Doushen (Beijing) Education & Technology's P/S Mean For Investors?
Doushen (Beijing) Education & Technology shares have taken a big step in a northerly direction, but its P/S is elevated as a result. We'd say the price-to-sales ratio's power isn't primarily as a valuation instrument but rather to gauge current investor sentiment and future expectations.
Our examination of Doushen (Beijing) Education & Technology revealed its shrinking revenue over the medium-term isn't resulting in a P/S as low as we expected, given the industry is set to grow. With a revenue decline on investors' minds, the likelihood of a souring sentiment is quite high which could send the P/S back in line with what we'd expect. If recent medium-term revenue trends continue, it will place shareholders' investments at significant risk and potential investors in danger of paying an excessive premium.
Having said that, be aware Doushen (Beijing) Education & Technology is showing 2 warning signs in our investment analysis, and 1 of those shouldn't be ignored.
If companies with solid past earnings growth is up your alley, you may wish to see this free collection of other companies with strong earnings growth and low P/E ratios.
New: Manage All Your Stock Portfolios in One Place
We've created the ultimate portfolio companion for stock investors, and it's free.
• Connect an unlimited number of Portfolios and see your total in one currency
• Be alerted to new Warning Signs or Risks via email or mobile
• Track the Fair Value of your stocks
Have feedback on this article? Concerned about the content? Get in touch with us directly. Alternatively, email editorial-team (at) simplywallst.com.
This article by Simply Wall St is general in nature. We provide commentary based on historical data and analyst forecasts only using an unbiased methodology and our articles are not intended to be financial advice. It does not constitute a recommendation to buy or sell any stock, and does not take account of your objectives, or your financial situation. We aim to bring you long-term focused analysis driven by fundamental data. Note that our analysis may not factor in the latest price-sensitive company announcements or qualitative material. Simply Wall St has no position in any stocks mentioned.
About SZSE:300010
Doushen (Beijing) Education & Technology
Doushen (Beijing) Education & Technology INC.
Reasonable growth potential with adequate balance sheet.
Market Insights


Advertisement
Community Narratives
Nike's Direct-to-Consumer Focus Will Drive Future Growth
Fair Value US$87.90|18.2% undervalued
UN
Community Contributor
Novo Nordisk will dominate GLP-1 market with Ozempic and Wegovy growth
Fair Value US$89.59|12.1% undervalued
BE
Community Contributor
Rheinmetall could get 20-25% of EU-NATO 3%-GDP defence spending
Fair Value €7.57k|82.8% undervalued
NO
Community Contributor