
Advertisement
- China
- /
- Semiconductors
- /
- SZSE:300493
Shanghai Fortune Techgroup Co., Ltd. (SZSE:300493) Surges 25% Yet Its Low P/S Is No Reason For Excitement

Shanghai Fortune Techgroup Co., Ltd. (SZSE:300493) shareholders are no doubt pleased to see that the share price has bounced 25% in the last month, although it is still struggling to make up recently lost ground. But the gains over the last month weren't enough to make shareholders whole, as the share price is still down 9.1% in the last twelve months.
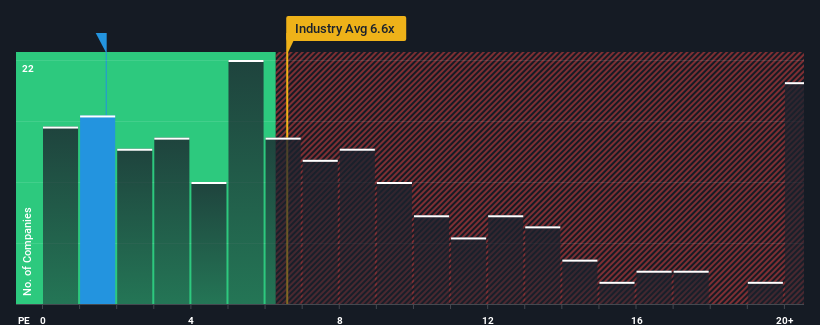
In spite of the firm bounce in price, Shanghai Fortune Techgroup may still look like a strong buying opportunity at present with its price-to-sales (or "P/S") ratio of 1.7x, considering almost half of all companies in the Semiconductor industry in China have P/S ratios greater than 6.6x and even P/S higher than 12x aren't out of the ordinary. Although, it's not wise to just take the P/S at face value as there may be an explanation why it's so limited.
Check out our latest analysis for Shanghai Fortune Techgroup
What Does Shanghai Fortune Techgroup's P/S Mean For Shareholders?
Shanghai Fortune Techgroup hasn't been tracking well recently as its declining revenue compares poorly to other companies, which have seen some growth in their revenues on average. The P/S ratio is probably low because investors think this poor revenue performance isn't going to get any better. If this is the case, then existing shareholders will probably struggle to get excited about the future direction of the share price.
If you'd like to see what analysts are forecasting going forward, you should check out our free report on Shanghai Fortune Techgroup.How Is Shanghai Fortune Techgroup's Revenue Growth Trending?
There's an inherent assumption that a company should far underperform the industry for P/S ratios like Shanghai Fortune Techgroup's to be considered reasonable.
If we review the last year of revenue, the company posted a result that saw barely any deviation from a year ago. Although pleasingly revenue has lifted 56% in aggregate from three years ago, notwithstanding the last 12 months. So while the company has done a solid job in the past, it's somewhat concerning to see revenue growth decline as much as it has.
Turning to the outlook, the next year should generate growth of 16% as estimated by the one analyst watching the company. That's shaping up to be materially lower than the 20,706% growth forecast for the broader industry.
With this in consideration, its clear as to why Shanghai Fortune Techgroup's P/S is falling short industry peers. Apparently many shareholders weren't comfortable holding on while the company is potentially eyeing a less prosperous future.
What Does Shanghai Fortune Techgroup's P/S Mean For Investors?
Shanghai Fortune Techgroup's recent share price jump still sees fails to bring its P/S alongside the industry median. Generally, our preference is to limit the use of the price-to-sales ratio to establishing what the market thinks about the overall health of a company.
We've established that Shanghai Fortune Techgroup maintains its low P/S on the weakness of its forecast growth being lower than the wider industry, as expected. Shareholders' pessimism on the revenue prospects for the company seems to be the main contributor to the depressed P/S. Unless these conditions improve, they will continue to form a barrier for the share price around these levels.
You should always think about risks. Case in point, we've spotted 2 warning signs for Shanghai Fortune Techgroup you should be aware of, and 1 of them makes us a bit uncomfortable.
It's important to make sure you look for a great company, not just the first idea you come across. So if growing profitability aligns with your idea of a great company, take a peek at this free list of interesting companies with strong recent earnings growth (and a low P/E).
New: Manage All Your Stock Portfolios in One Place
We've created the ultimate portfolio companion for stock investors, and it's free.
• Connect an unlimited number of Portfolios and see your total in one currency
• Be alerted to new Warning Signs or Risks via email or mobile
• Track the Fair Value of your stocks
Have feedback on this article? Concerned about the content? Get in touch with us directly. Alternatively, email editorial-team (at) simplywallst.com.
This article by Simply Wall St is general in nature. We provide commentary based on historical data and analyst forecasts only using an unbiased methodology and our articles are not intended to be financial advice. It does not constitute a recommendation to buy or sell any stock, and does not take account of your objectives, or your financial situation. We aim to bring you long-term focused analysis driven by fundamental data. Note that our analysis may not factor in the latest price-sensitive company announcements or qualitative material. Simply Wall St has no position in any stocks mentioned.
About SZSE:300493
Shanghai Fortune Techgroup
Provides semiconductor products and solutions in China.
Reasonable growth potential with adequate balance sheet.
Market Insights

Advertisement
Community Narratives

Apple: A Dying Star with an Overpriced Valuation
Fair Value US$177.34|20.1% overvalued
IN
Community Contributor
Avino a case for USD$20 per share within 5 years (assuming $3,500 gold, $100 silver and $4 copper).
Fair Value CA$26.79|87.5% undervalued
AG
Community Contributor
Riding the Defense Boom RENK Sees Revenue Climb at 15% CAGR by FY 2029
Fair Value €69.87|20.5% undervalued
CH
Community Contributor