- China
- /
- Semiconductors
- /
- SZSE:300493
Shanghai Fortune Techgroup Co., Ltd. (SZSE:300493) Stock Catapults 26% Though Its Price And Business Still Lag The Industry


The Shanghai Fortune Techgroup Co., Ltd. (SZSE:300493) share price has done very well over the last month, posting an excellent gain of 26%. The bad news is that even after the stocks recovery in the last 30 days, shareholders are still underwater by about 5.9% over the last year.
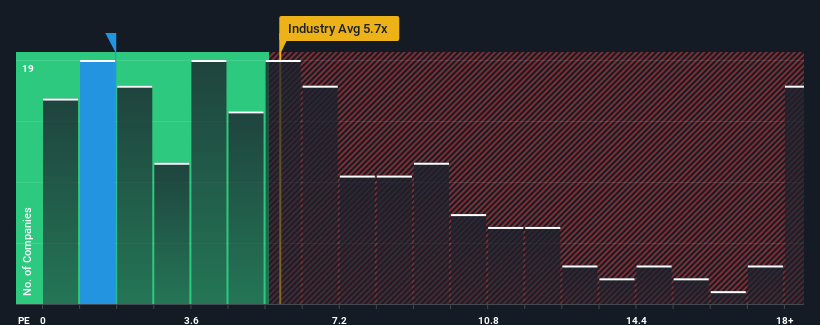
In spite of the firm bounce in price, Shanghai Fortune Techgroup may still be sending very bullish signals at the moment with its price-to-sales (or "P/S") ratio of 1.8x, since almost half of all companies in the Semiconductor industry in China have P/S ratios greater than 5.7x and even P/S higher than 10x are not unusual. However, the P/S might be quite low for a reason and it requires further investigation to determine if it's justified.
View our latest analysis for Shanghai Fortune Techgroup
How Has Shanghai Fortune Techgroup Performed Recently?
Shanghai Fortune Techgroup could be doing better as it's been growing revenue less than most other companies lately. It seems that many are expecting the uninspiring revenue performance to persist, which has repressed the growth of the P/S ratio. If you still like the company, you'd be hoping revenue doesn't get any worse and that you could pick up some stock while it's out of favour.
Keen to find out how analysts think Shanghai Fortune Techgroup's future stacks up against the industry? In that case, our free report is a great place to start.Do Revenue Forecasts Match The Low P/S Ratio?
The only time you'd be truly comfortable seeing a P/S as depressed as Shanghai Fortune Techgroup's is when the company's growth is on track to lag the industry decidedly.
If we review the last year of revenue growth, the company posted a worthy increase of 9.9%. Pleasingly, revenue has also lifted 54% in aggregate from three years ago, partly thanks to the last 12 months of growth. Accordingly, shareholders would have definitely welcomed those medium-term rates of revenue growth.
Looking ahead now, revenue is anticipated to climb by 12% during the coming year according to the only analyst following the company. Meanwhile, the rest of the industry is forecast to expand by 36%, which is noticeably more attractive.
With this information, we can see why Shanghai Fortune Techgroup is trading at a P/S lower than the industry. Apparently many shareholders weren't comfortable holding on while the company is potentially eyeing a less prosperous future.
The Bottom Line On Shanghai Fortune Techgroup's P/S
Shanghai Fortune Techgroup's recent share price jump still sees fails to bring its P/S alongside the industry median. Typically, we'd caution against reading too much into price-to-sales ratios when settling on investment decisions, though it can reveal plenty about what other market participants think about the company.
As expected, our analysis of Shanghai Fortune Techgroup's analyst forecasts confirms that the company's underwhelming revenue outlook is a major contributor to its low P/S. Shareholders' pessimism on the revenue prospects for the company seems to be the main contributor to the depressed P/S. Unless these conditions improve, they will continue to form a barrier for the share price around these levels.
Many other vital risk factors can be found on the company's balance sheet. Our free balance sheet analysis for Shanghai Fortune Techgroup with six simple checks will allow you to discover any risks that could be an issue.
It's important to make sure you look for a great company, not just the first idea you come across. So if growing profitability aligns with your idea of a great company, take a peek at this free list of interesting companies with strong recent earnings growth (and a low P/E).
New: Manage All Your Stock Portfolios in One Place
We've created the ultimate portfolio companion for stock investors, and it's free.
• Connect an unlimited number of Portfolios and see your total in one currency
• Be alerted to new Warning Signs or Risks via email or mobile
• Track the Fair Value of your stocks
Have feedback on this article? Concerned about the content? Get in touch with us directly. Alternatively, email editorial-team (at) simplywallst.com.
This article by Simply Wall St is general in nature. We provide commentary based on historical data and analyst forecasts only using an unbiased methodology and our articles are not intended to be financial advice. It does not constitute a recommendation to buy or sell any stock, and does not take account of your objectives, or your financial situation. We aim to bring you long-term focused analysis driven by fundamental data. Note that our analysis may not factor in the latest price-sensitive company announcements or qualitative material. Simply Wall St has no position in any stocks mentioned.
About SZSE:300493
Shanghai Fortune Techgroup
Provides semiconductor products and solutions in China.
Excellent balance sheet with moderate growth potential.
Market Insights

Community Narratives
