- China
- /
- Semiconductors
- /
- SZSE:300125
Lingda Group Co., Ltd. (SZSE:300125) Stock Catapults 44% Though Its Price And Business Still Lag The Industry


Lingda Group Co., Ltd. (SZSE:300125) shareholders are no doubt pleased to see that the share price has bounced 44% in the last month, although it is still struggling to make up recently lost ground. Still, the 30-day jump doesn't change the fact that longer term shareholders have seen their stock decimated by the 84% share price drop in the last twelve months.
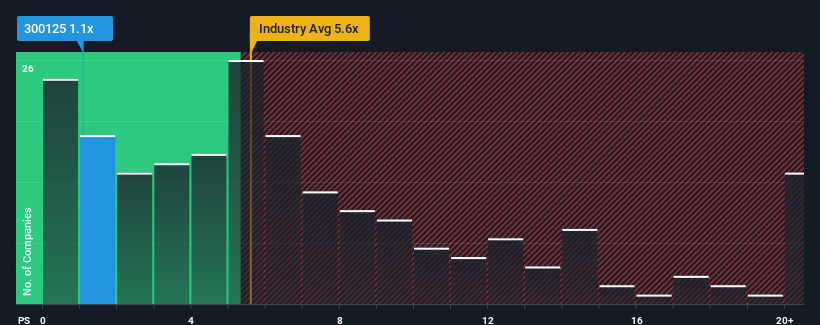
In spite of the firm bounce in price, Lingda Group's price-to-sales (or "P/S") ratio of 1.1x might still make it look like a strong buy right now compared to the wider Semiconductor industry in China, where around half of the companies have P/S ratios above 5.6x and even P/S above 10x are quite common. Although, it's not wise to just take the P/S at face value as there may be an explanation why it's so limited.
See our latest analysis for Lingda Group
What Does Lingda Group's Recent Performance Look Like?
For instance, Lingda Group's receding revenue in recent times would have to be some food for thought. One possibility is that the P/S is low because investors think the company won't do enough to avoid underperforming the broader industry in the near future. However, if this doesn't eventuate then existing shareholders may be feeling optimistic about the future direction of the share price.
Although there are no analyst estimates available for Lingda Group, take a look at this free data-rich visualisation to see how the company stacks up on earnings, revenue and cash flow.Do Revenue Forecasts Match The Low P/S Ratio?
In order to justify its P/S ratio, Lingda Group would need to produce anemic growth that's substantially trailing the industry.
Taking a look back first, the company's revenue growth last year wasn't something to get excited about as it posted a disappointing decline of 58%. This has soured the latest three-year period, which nevertheless managed to deliver a decent 23% overall rise in revenue. Although it's been a bumpy ride, it's still fair to say the revenue growth recently has been mostly respectable for the company.
Comparing that to the industry, which is predicted to deliver 36% growth in the next 12 months, the company's momentum is weaker, based on recent medium-term annualised revenue results.
With this information, we can see why Lingda Group is trading at a P/S lower than the industry. It seems most investors are expecting to see the recent limited growth rates continue into the future and are only willing to pay a reduced amount for the stock.
The Final Word
Even after such a strong price move, Lingda Group's P/S still trails the rest of the industry. Using the price-to-sales ratio alone to determine if you should sell your stock isn't sensible, however it can be a practical guide to the company's future prospects.
As we suspected, our examination of Lingda Group revealed its three-year revenue trends are contributing to its low P/S, given they look worse than current industry expectations. Right now shareholders are accepting the low P/S as they concede future revenue probably won't provide any pleasant surprises. If recent medium-term revenue trends continue, it's hard to see the share price experience a reversal of fortunes anytime soon.
And what about other risks? Every company has them, and we've spotted 4 warning signs for Lingda Group (of which 2 are a bit unpleasant!) you should know about.
If you're unsure about the strength of Lingda Group's business, why not explore our interactive list of stocks with solid business fundamentals for some other companies you may have missed.
If you're looking to trade Lingda Group, open an account with the lowest-cost platform trusted by professionals, Interactive Brokers.
With clients in over 200 countries and territories, and access to 160 markets, IBKR lets you trade stocks, options, futures, forex, bonds and funds from a single integrated account.
Enjoy no hidden fees, no account minimums, and FX conversion rates as low as 0.03%, far better than what most brokers offer.
Sponsored ContentNew: AI Stock Screener & Alerts
Our new AI Stock Screener scans the market every day to uncover opportunities.
• Dividend Powerhouses (3%+ Yield)
• Undervalued Small Caps with Insider Buying
• High growth Tech and AI Companies
Or build your own from over 50 metrics.
Have feedback on this article? Concerned about the content? Get in touch with us directly. Alternatively, email editorial-team (at) simplywallst.com.
This article by Simply Wall St is general in nature. We provide commentary based on historical data and analyst forecasts only using an unbiased methodology and our articles are not intended to be financial advice. It does not constitute a recommendation to buy or sell any stock, and does not take account of your objectives, or your financial situation. We aim to bring you long-term focused analysis driven by fundamental data. Note that our analysis may not factor in the latest price-sensitive company announcements or qualitative material. Simply Wall St has no position in any stocks mentioned.
Have feedback on this article? Concerned about the content? Get in touch with us directly. Alternatively, email editorial-team@simplywallst.com
About SZSE:300125
Lingda Group
Engages in the new energy industry development, ecological environment improvement, and energy saving activities in China.
Slight with worrying balance sheet.
Market Insights

Community Narratives

