- China
- /
- Semiconductors
- /
- SHSE:600732
Market Cool On Shanghai Aiko Solar Energy Co.,Ltd.'s (SHSE:600732) Revenues Pushing Shares 31% Lower

The Shanghai Aiko Solar Energy Co.,Ltd. (SHSE:600732) share price has softened a substantial 31% over the previous 30 days, handing back much of the gains the stock has made lately. The drop over the last 30 days has capped off a tough year for shareholders, with the share price down 36% in that time.
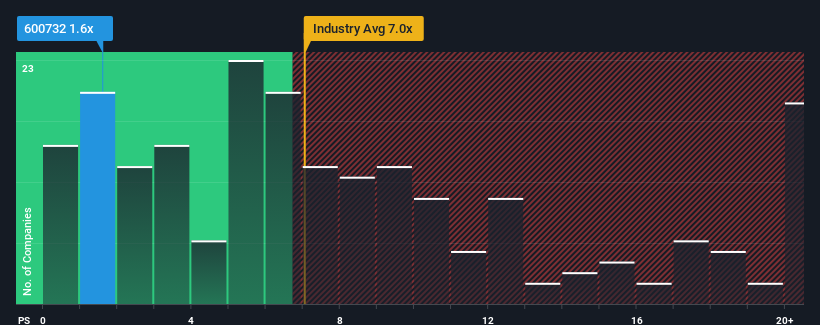
Following the heavy fall in price, Shanghai Aiko Solar EnergyLtd may be sending very bullish signals at the moment with its price-to-sales (or "P/S") ratio of 1.6x, since almost half of all companies in the Semiconductor industry in China have P/S ratios greater than 7x and even P/S higher than 13x are not unusual. Although, it's not wise to just take the P/S at face value as there may be an explanation why it's so limited.
See our latest analysis for Shanghai Aiko Solar EnergyLtd

What Does Shanghai Aiko Solar EnergyLtd's P/S Mean For Shareholders?
Shanghai Aiko Solar EnergyLtd hasn't been tracking well recently as its declining revenue compares poorly to other companies, which have seen some growth in their revenues on average. The P/S ratio is probably low because investors think this poor revenue performance isn't going to get any better. If this is the case, then existing shareholders will probably struggle to get excited about the future direction of the share price.
If you'd like to see what analysts are forecasting going forward, you should check out our free report on Shanghai Aiko Solar EnergyLtd.Do Revenue Forecasts Match The Low P/S Ratio?
In order to justify its P/S ratio, Shanghai Aiko Solar EnergyLtd would need to produce anemic growth that's substantially trailing the industry.
In reviewing the last year of financials, we were disheartened to see the company's revenues fell to the tune of 61%. This means it has also seen a slide in revenue over the longer-term as revenue is down 15% in total over the last three years. Accordingly, shareholders would have felt downbeat about the medium-term rates of revenue growth.
Shifting to the future, estimates from the seven analysts covering the company suggest revenue should grow by 160% over the next year. Meanwhile, the rest of the industry is forecast to only expand by 51%, which is noticeably less attractive.
In light of this, it's peculiar that Shanghai Aiko Solar EnergyLtd's P/S sits below the majority of other companies. Apparently some shareholders are doubtful of the forecasts and have been accepting significantly lower selling prices.
The Bottom Line On Shanghai Aiko Solar EnergyLtd's P/S
Shanghai Aiko Solar EnergyLtd's P/S looks about as weak as its stock price lately. Typically, we'd caution against reading too much into price-to-sales ratios when settling on investment decisions, though it can reveal plenty about what other market participants think about the company.
Shanghai Aiko Solar EnergyLtd's analyst forecasts revealed that its superior revenue outlook isn't contributing to its P/S anywhere near as much as we would have predicted. The reason for this depressed P/S could potentially be found in the risks the market is pricing in. While the possibility of the share price plunging seems unlikely due to the high growth forecasted for the company, the market does appear to have some hesitation.
You need to take note of risks, for example - Shanghai Aiko Solar EnergyLtd has 2 warning signs (and 1 which is significant) we think you should know about.
If strong companies turning a profit tickle your fancy, then you'll want to check out this free list of interesting companies that trade on a low P/E (but have proven they can grow earnings).
New: Manage All Your Stock Portfolios in One Place
We've created the ultimate portfolio companion for stock investors, and it's free.
• Connect an unlimited number of Portfolios and see your total in one currency
• Be alerted to new Warning Signs or Risks via email or mobile
• Track the Fair Value of your stocks
Have feedback on this article? Concerned about the content? Get in touch with us directly. Alternatively, email editorial-team (at) simplywallst.com.
This article by Simply Wall St is general in nature. We provide commentary based on historical data and analyst forecasts only using an unbiased methodology and our articles are not intended to be financial advice. It does not constitute a recommendation to buy or sell any stock, and does not take account of your objectives, or your financial situation. We aim to bring you long-term focused analysis driven by fundamental data. Note that our analysis may not factor in the latest price-sensitive company announcements or qualitative material. Simply Wall St has no position in any stocks mentioned.
About SHSE:600732
Shanghai Aiko Solar EnergyLtd
Engages in the research, manufacture, and sale of crystalline silicon solar cells.
Undervalued with high growth potential.
Market Insights
Community Narratives


