- China
- /
- Retail Distributors
- /
- SHSE:600981
What Jiangsu High Hope International Group Corporation's (SHSE:600981) 39% Share Price Gain Is Not Telling You

The Jiangsu High Hope International Group Corporation (SHSE:600981) share price has done very well over the last month, posting an excellent gain of 39%. Unfortunately, the gains of the last month did little to right the losses of the last year with the stock still down 18% over that time.
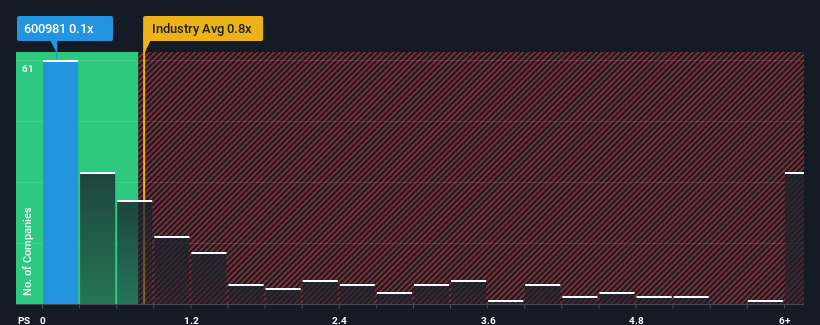
Even after such a large jump in price, it's still not a stretch to say that Jiangsu High Hope International Group's price-to-sales (or "P/S") ratio of 0.1x right now seems quite "middle-of-the-road" compared to the Retail Distributors industry in China, where the median P/S ratio is around 0.4x. Although, it's not wise to simply ignore the P/S without explanation as investors may be disregarding a distinct opportunity or a costly mistake.
See our latest analysis for Jiangsu High Hope International Group
How Has Jiangsu High Hope International Group Performed Recently?
As an illustration, revenue has deteriorated at Jiangsu High Hope International Group over the last year, which is not ideal at all. Perhaps investors believe the recent revenue performance is enough to keep in line with the industry, which is keeping the P/S from dropping off. If you like the company, you'd at least be hoping this is the case so that you could potentially pick up some stock while it's not quite in favour.
Although there are no analyst estimates available for Jiangsu High Hope International Group, take a look at this free data-rich visualisation to see how the company stacks up on earnings, revenue and cash flow.How Is Jiangsu High Hope International Group's Revenue Growth Trending?
Jiangsu High Hope International Group's P/S ratio would be typical for a company that's only expected to deliver moderate growth, and importantly, perform in line with the industry.
In reviewing the last year of financials, we were disheartened to see the company's revenues fell to the tune of 1.6%. This has erased any of its gains during the last three years, with practically no change in revenue being achieved in total. So it appears to us that the company has had a mixed result in terms of growing revenue over that time.
Comparing that to the industry, which is predicted to deliver 29% growth in the next 12 months, the company's momentum is weaker, based on recent medium-term annualised revenue results.
With this information, we find it interesting that Jiangsu High Hope International Group is trading at a fairly similar P/S compared to the industry. It seems most investors are ignoring the fairly limited recent growth rates and are willing to pay up for exposure to the stock. They may be setting themselves up for future disappointment if the P/S falls to levels more in line with recent growth rates.
The Key Takeaway
Its shares have lifted substantially and now Jiangsu High Hope International Group's P/S is back within range of the industry median. Generally, our preference is to limit the use of the price-to-sales ratio to establishing what the market thinks about the overall health of a company.
We've established that Jiangsu High Hope International Group's average P/S is a bit surprising since its recent three-year growth is lower than the wider industry forecast. Right now we are uncomfortable with the P/S as this revenue performance isn't likely to support a more positive sentiment for long. Unless the recent medium-term conditions improve, it's hard to accept the current share price as fair value.
Having said that, be aware Jiangsu High Hope International Group is showing 2 warning signs in our investment analysis, you should know about.
If these risks are making you reconsider your opinion on Jiangsu High Hope International Group, explore our interactive list of high quality stocks to get an idea of what else is out there.
New: Manage All Your Stock Portfolios in One Place
We've created the ultimate portfolio companion for stock investors, and it's free.
• Connect an unlimited number of Portfolios and see your total in one currency
• Be alerted to new Warning Signs or Risks via email or mobile
• Track the Fair Value of your stocks
Have feedback on this article? Concerned about the content? Get in touch with us directly. Alternatively, email editorial-team (at) simplywallst.com.
This article by Simply Wall St is general in nature. We provide commentary based on historical data and analyst forecasts only using an unbiased methodology and our articles are not intended to be financial advice. It does not constitute a recommendation to buy or sell any stock, and does not take account of your objectives, or your financial situation. We aim to bring you long-term focused analysis driven by fundamental data. Note that our analysis may not factor in the latest price-sensitive company announcements or qualitative material. Simply Wall St has no position in any stocks mentioned.
About SHSE:600981
Jiangsu High Hope International Group
Engages in trade, real estate, investment, logistics, manufacturing, services, etc.
Low and slightly overvalued.
Market Insights

Community Narratives
