- China
- /
- General Merchandise and Department Stores
- /
- SHSE:600778
Xinjiang Youhao(Group)Co.,Ltd (SHSE:600778) Shares Fly 31% But Investors Aren't Buying For Growth

Despite an already strong run, Xinjiang Youhao(Group)Co.,Ltd (SHSE:600778) shares have been powering on, with a gain of 31% in the last thirty days. Taking a wider view, although not as strong as the last month, the full year gain of 17% is also fairly reasonable.
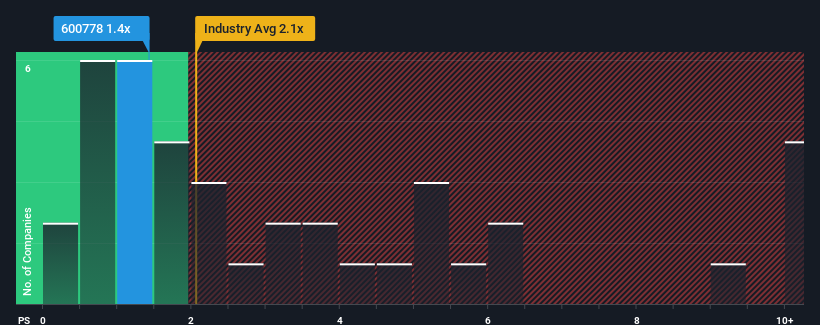
Although its price has surged higher, Xinjiang Youhao(Group)Co.Ltd may still be sending buy signals at present with its price-to-sales (or "P/S") ratio of 1.4x, considering almost half of all companies in the Multiline Retail industry in China have P/S ratios greater than 2.1x and even P/S higher than 5x aren't out of the ordinary. Although, it's not wise to just take the P/S at face value as there may be an explanation why it's limited.
See our latest analysis for Xinjiang Youhao(Group)Co.Ltd

How Has Xinjiang Youhao(Group)Co.Ltd Performed Recently?
Xinjiang Youhao(Group)Co.Ltd has been doing a decent job lately as it's been growing revenue at a reasonable pace. Perhaps the market believes the recent revenue performance might fall short of industry figures in the near future, leading to a reduced P/S. If you like the company, you'd be hoping this isn't the case so that you could potentially pick up some stock while it's out of favour.
Although there are no analyst estimates available for Xinjiang Youhao(Group)Co.Ltd, take a look at this free data-rich visualisation to see how the company stacks up on earnings, revenue and cash flow.What Are Revenue Growth Metrics Telling Us About The Low P/S?
The only time you'd be truly comfortable seeing a P/S as low as Xinjiang Youhao(Group)Co.Ltd's is when the company's growth is on track to lag the industry.
Retrospectively, the last year delivered a decent 2.9% gain to the company's revenues. Still, lamentably revenue has fallen 23% in aggregate from three years ago, which is disappointing. Therefore, it's fair to say the revenue growth recently has been undesirable for the company.
Weighing that medium-term revenue trajectory against the broader industry's one-year forecast for expansion of 13% shows it's an unpleasant look.
With this information, we are not surprised that Xinjiang Youhao(Group)Co.Ltd is trading at a P/S lower than the industry. However, we think shrinking revenues are unlikely to lead to a stable P/S over the longer term, which could set up shareholders for future disappointment. Even just maintaining these prices could be difficult to achieve as recent revenue trends are already weighing down the shares.
The Bottom Line On Xinjiang Youhao(Group)Co.Ltd's P/S
Despite Xinjiang Youhao(Group)Co.Ltd's share price climbing recently, its P/S still lags most other companies. Generally, our preference is to limit the use of the price-to-sales ratio to establishing what the market thinks about the overall health of a company.
As we suspected, our examination of Xinjiang Youhao(Group)Co.Ltd revealed its shrinking revenue over the medium-term is contributing to its low P/S, given the industry is set to grow. Right now shareholders are accepting the low P/S as they concede future revenue probably won't provide any pleasant surprises either. If recent medium-term revenue trends continue, it's hard to see the share price moving strongly in either direction in the near future under these circumstances.
It is also worth noting that we have found 1 warning sign for Xinjiang Youhao(Group)Co.Ltd that you need to take into consideration.
Of course, profitable companies with a history of great earnings growth are generally safer bets. So you may wish to see this free collection of other companies that have reasonable P/E ratios and have grown earnings strongly.
New: AI Stock Screener & Alerts
Our new AI Stock Screener scans the market every day to uncover opportunities.
• Dividend Powerhouses (3%+ Yield)
• Undervalued Small Caps with Insider Buying
• High growth Tech and AI Companies
Or build your own from over 50 metrics.
Have feedback on this article? Concerned about the content? Get in touch with us directly. Alternatively, email editorial-team (at) simplywallst.com.
This article by Simply Wall St is general in nature. We provide commentary based on historical data and analyst forecasts only using an unbiased methodology and our articles are not intended to be financial advice. It does not constitute a recommendation to buy or sell any stock, and does not take account of your objectives, or your financial situation. We aim to bring you long-term focused analysis driven by fundamental data. Note that our analysis may not factor in the latest price-sensitive company announcements or qualitative material. Simply Wall St has no position in any stocks mentioned.
About SHSE:600778
Xinjiang Youhao(Group)Co.Ltd
Operates as a commercial retail enterprise in China.
Good value with mediocre balance sheet.


