Shandong Kexing Bioproducts Co,.Ltd (SHSE:688136) Held Back By Insufficient Growth Even After Shares Climb 25%


Shandong Kexing Bioproducts Co,.Ltd (SHSE:688136) shareholders are no doubt pleased to see that the share price has bounced 25% in the last month, although it is still struggling to make up recently lost ground. Not all shareholders will be feeling jubilant, since the share price is still down a very disappointing 31% in the last twelve months.
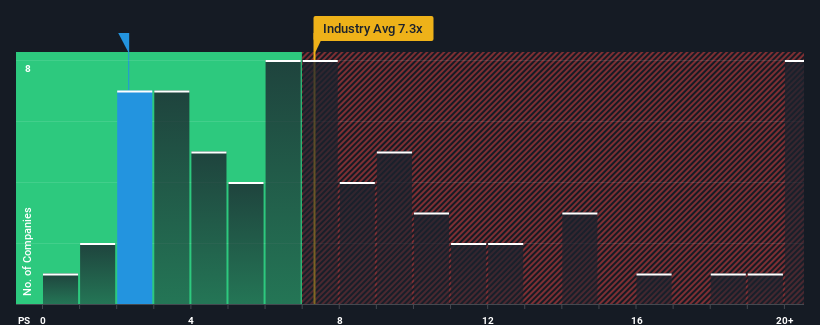
In spite of the firm bounce in price, Shandong Kexing Bioproducts Co.Ltd may still look like a strong buying opportunity at present with its price-to-sales (or "P/S") ratio of 2.3x, considering almost half of all companies in the Biotechs industry in China have P/S ratios greater than 7.3x and even P/S higher than 12x aren't out of the ordinary. Nonetheless, we'd need to dig a little deeper to determine if there is a rational basis for the highly reduced P/S.
Check out our latest analysis for Shandong Kexing Bioproducts Co.Ltd
What Does Shandong Kexing Bioproducts Co.Ltd's P/S Mean For Shareholders?
Shandong Kexing Bioproducts Co.Ltd hasn't been tracking well recently as its declining revenue compares poorly to other companies, which have seen some growth in their revenues on average. The P/S ratio is probably low because investors think this poor revenue performance isn't going to get any better. If this is the case, then existing shareholders will probably struggle to get excited about the future direction of the share price.
If you'd like to see what analysts are forecasting going forward, you should check out our free report on Shandong Kexing Bioproducts Co.Ltd.How Is Shandong Kexing Bioproducts Co.Ltd's Revenue Growth Trending?
The only time you'd be truly comfortable seeing a P/S as depressed as Shandong Kexing Bioproducts Co.Ltd's is when the company's growth is on track to lag the industry decidedly.
In reviewing the last year of financials, we were disheartened to see the company's revenues fell to the tune of 4.3%. This has erased any of its gains during the last three years, with practically no change in revenue being achieved in total. Accordingly, shareholders probably wouldn't have been overly satisfied with the unstable medium-term growth rates.
Turning to the outlook, the next year should generate growth of 12% as estimated by the dual analysts watching the company. That's shaping up to be materially lower than the 162% growth forecast for the broader industry.
In light of this, it's understandable that Shandong Kexing Bioproducts Co.Ltd's P/S sits below the majority of other companies. Apparently many shareholders weren't comfortable holding on while the company is potentially eyeing a less prosperous future.
What We Can Learn From Shandong Kexing Bioproducts Co.Ltd's P/S?
Shares in Shandong Kexing Bioproducts Co.Ltd have risen appreciably however, its P/S is still subdued. Using the price-to-sales ratio alone to determine if you should sell your stock isn't sensible, however it can be a practical guide to the company's future prospects.
As we suspected, our examination of Shandong Kexing Bioproducts Co.Ltd's analyst forecasts revealed that its inferior revenue outlook is contributing to its low P/S. Right now shareholders are accepting the low P/S as they concede future revenue probably won't provide any pleasant surprises. The company will need a change of fortune to justify the P/S rising higher in the future.
There are also other vital risk factors to consider before investing and we've discovered 1 warning sign for Shandong Kexing Bioproducts Co.Ltd that you should be aware of.
Of course, profitable companies with a history of great earnings growth are generally safer bets. So you may wish to see this free collection of other companies that have reasonable P/E ratios and have grown earnings strongly.
If you're looking to trade Kexing Biopharm, open an account with the lowest-cost platform trusted by professionals, Interactive Brokers.
With clients in over 200 countries and territories, and access to 160 markets, IBKR lets you trade stocks, options, futures, forex, bonds and funds from a single integrated account.
Enjoy no hidden fees, no account minimums, and FX conversion rates as low as 0.03%, far better than what most brokers offer.
Sponsored ContentValuation is complex, but we're here to simplify it.
Discover if Kexing Biopharm might be undervalued or overvalued with our detailed analysis, featuring fair value estimates, potential risks, dividends, insider trades, and its financial condition.
Access Free AnalysisHave feedback on this article? Concerned about the content? Get in touch with us directly. Alternatively, email editorial-team (at) simplywallst.com.
This article by Simply Wall St is general in nature. We provide commentary based on historical data and analyst forecasts only using an unbiased methodology and our articles are not intended to be financial advice. It does not constitute a recommendation to buy or sell any stock, and does not take account of your objectives, or your financial situation. We aim to bring you long-term focused analysis driven by fundamental data. Note that our analysis may not factor in the latest price-sensitive company announcements or qualitative material. Simply Wall St has no position in any stocks mentioned.
About SHSE:688136
Kexing Biopharm
Engages in the research and development, production, and sale of recombinant protein drugs and microbial preparations in China and internationally.
High growth potential with adequate balance sheet.
Market Insights

Community Narratives

