
Advertisement
Guangdong Brandmax Marketing Co.,Ltd. (SZSE:300805) Surges 40% Yet Its Low P/S Is No Reason For Excitement

The Guangdong Brandmax Marketing Co.,Ltd. (SZSE:300805) share price has done very well over the last month, posting an excellent gain of 40%. Looking further back, the 11% rise over the last twelve months isn't too bad notwithstanding the strength over the last 30 days.
Even after such a large jump in price, Guangdong Brandmax MarketingLtd's price-to-sales (or "P/S") ratio of 1.8x might still make it look like a buy right now compared to the Media industry in China, where around half of the companies have P/S ratios above 2.7x and even P/S above 7x are quite common. Although, it's not wise to just take the P/S at face value as there may be an explanation why it's limited.
See our latest analysis for Guangdong Brandmax MarketingLtd
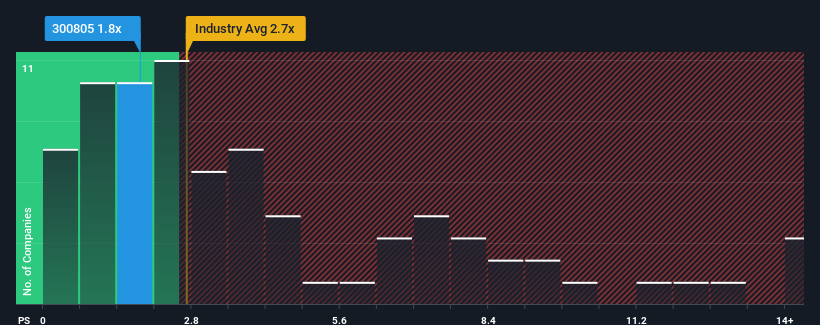
What Does Guangdong Brandmax MarketingLtd's P/S Mean For Shareholders?
As an illustration, revenue has deteriorated at Guangdong Brandmax MarketingLtd over the last year, which is not ideal at all. Perhaps the market believes the recent revenue performance isn't good enough to keep up the industry, causing the P/S ratio to suffer. Those who are bullish on Guangdong Brandmax MarketingLtd will be hoping that this isn't the case so that they can pick up the stock at a lower valuation.
Although there are no analyst estimates available for Guangdong Brandmax MarketingLtd, take a look at this free data-rich visualisation to see how the company stacks up on earnings, revenue and cash flow.How Is Guangdong Brandmax MarketingLtd's Revenue Growth Trending?
The only time you'd be truly comfortable seeing a P/S as low as Guangdong Brandmax MarketingLtd's is when the company's growth is on track to lag the industry.
Taking a look back first, the company's revenue growth last year wasn't something to get excited about as it posted a disappointing decline of 1.4%. The last three years don't look nice either as the company has shrunk revenue by 35% in aggregate. Accordingly, shareholders would have felt downbeat about the medium-term rates of revenue growth.
Weighing that medium-term revenue trajectory against the broader industry's one-year forecast for expansion of 13% shows it's an unpleasant look.
With this in mind, we understand why Guangdong Brandmax MarketingLtd's P/S is lower than most of its industry peers. However, we think shrinking revenues are unlikely to lead to a stable P/S over the longer term, which could set up shareholders for future disappointment. There's potential for the P/S to fall to even lower levels if the company doesn't improve its top-line growth.
The Final Word
Despite Guangdong Brandmax MarketingLtd's share price climbing recently, its P/S still lags most other companies. Generally, our preference is to limit the use of the price-to-sales ratio to establishing what the market thinks about the overall health of a company.
It's no surprise that Guangdong Brandmax MarketingLtd maintains its low P/S off the back of its sliding revenue over the medium-term. At this stage investors feel the potential for an improvement in revenue isn't great enough to justify a higher P/S ratio. If recent medium-term revenue trends continue, it's hard to see the share price moving strongly in either direction in the near future under these circumstances.
It's always necessary to consider the ever-present spectre of investment risk. We've identified 3 warning signs with Guangdong Brandmax MarketingLtd (at least 2 which shouldn't be ignored), and understanding them should be part of your investment process.
It's important to make sure you look for a great company, not just the first idea you come across. So if growing profitability aligns with your idea of a great company, take a peek at this free list of interesting companies with strong recent earnings growth (and a low P/E).
New: Manage All Your Stock Portfolios in One Place
We've created the ultimate portfolio companion for stock investors, and it's free.
• Connect an unlimited number of Portfolios and see your total in one currency
• Be alerted to new Warning Signs or Risks via email or mobile
• Track the Fair Value of your stocks
Have feedback on this article? Concerned about the content? Get in touch with us directly. Alternatively, email editorial-team (at) simplywallst.com.
This article by Simply Wall St is general in nature. We provide commentary based on historical data and analyst forecasts only using an unbiased methodology and our articles are not intended to be financial advice. It does not constitute a recommendation to buy or sell any stock, and does not take account of your objectives, or your financial situation. We aim to bring you long-term focused analysis driven by fundamental data. Note that our analysis may not factor in the latest price-sensitive company announcements or qualitative material. Simply Wall St has no position in any stocks mentioned.
About SZSE:300805
Guangdong Brandmax MarketingLtd
Provides technology-driven new scene experience marketing services in China and internationally.
Flawless balance sheet low.
Market Insights

Advertisement
Community Narratives
The Most Undervalued of the Magnificent 7
Fair Value US$237.43|36.3% undervalued
IN
Community Contributor
PVA TePla's New Strategy Aims for 22% Revenue Growth in Semiconductor Recovery
Fair Value €19.19|20.8% undervalued
MI
Community Contributor