After Leaping 33% CITIC Guoan Information Industry Co., Ltd. (SZSE:000839) Shares Are Not Flying Under The Radar


CITIC Guoan Information Industry Co., Ltd. (SZSE:000839) shares have had a really impressive month, gaining 33% after a shaky period beforehand. Looking further back, the 13% rise over the last twelve months isn't too bad notwithstanding the strength over the last 30 days.
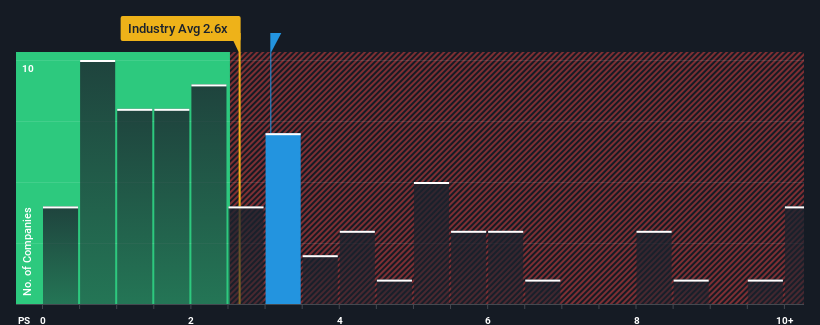
Even after such a large jump in price, it's still not a stretch to say that CITIC Guoan Information Industry's price-to-sales (or "P/S") ratio of 3.1x right now seems quite "middle-of-the-road" compared to the Media industry in China, where the median P/S ratio is around 2.6x. While this might not raise any eyebrows, if the P/S ratio is not justified investors could be missing out on a potential opportunity or ignoring looming disappointment.
Check out our latest analysis for CITIC Guoan Information Industry
What Does CITIC Guoan Information Industry's P/S Mean For Shareholders?
CITIC Guoan Information Industry has been doing a good job lately as it's been growing revenue at a solid pace. One possibility is that the P/S is moderate because investors think this respectable revenue growth might not be enough to outperform the broader industry in the near future. Those who are bullish on CITIC Guoan Information Industry will be hoping that this isn't the case, so that they can pick up the stock at a lower valuation.
Although there are no analyst estimates available for CITIC Guoan Information Industry, take a look at this free data-rich visualisation to see how the company stacks up on earnings, revenue and cash flow.What Are Revenue Growth Metrics Telling Us About The P/S?
In order to justify its P/S ratio, CITIC Guoan Information Industry would need to produce growth that's similar to the industry.
Retrospectively, the last year delivered a decent 13% gain to the company's revenues. Pleasingly, revenue has also lifted 37% in aggregate from three years ago, partly thanks to the last 12 months of growth. Therefore, it's fair to say the revenue growth recently has been superb for the company.
Comparing that to the industry, which is predicted to deliver 12% growth in the next 12 months, the company's momentum is pretty similar based on recent medium-term annualised revenue results.
With this in consideration, it's clear to see why CITIC Guoan Information Industry's P/S matches up closely to its industry peers. Apparently shareholders are comfortable to simply hold on assuming the company will continue keeping a low profile.
What Does CITIC Guoan Information Industry's P/S Mean For Investors?
Its shares have lifted substantially and now CITIC Guoan Information Industry's P/S is back within range of the industry median. Generally, our preference is to limit the use of the price-to-sales ratio to establishing what the market thinks about the overall health of a company.
As we've seen, CITIC Guoan Information Industry's three-year revenue trends seem to be contributing to its P/S, given they look similar to current industry expectations. Currently, with a past revenue trend that aligns closely wit the industry outlook, shareholders are confident the company's future revenue outlook won't contain any major surprises. If recent medium-term revenue trends continue, it's hard to see the share price moving strongly in either direction in the near future under these circumstances.
There are also other vital risk factors to consider before investing and we've discovered 2 warning signs for CITIC Guoan Information Industry that you should be aware of.
Of course, profitable companies with a history of great earnings growth are generally safer bets. So you may wish to see this free collection of other companies that have reasonable P/E ratios and have grown earnings strongly.
New: AI Stock Screener & Alerts
Our new AI Stock Screener scans the market every day to uncover opportunities.
• Dividend Powerhouses (3%+ Yield)
• Undervalued Small Caps with Insider Buying
• High growth Tech and AI Companies
Or build your own from over 50 metrics.
Have feedback on this article? Concerned about the content? Get in touch with us directly. Alternatively, email editorial-team (at) simplywallst.com.
This article by Simply Wall St is general in nature. We provide commentary based on historical data and analyst forecasts only using an unbiased methodology and our articles are not intended to be financial advice. It does not constitute a recommendation to buy or sell any stock, and does not take account of your objectives, or your financial situation. We aim to bring you long-term focused analysis driven by fundamental data. Note that our analysis may not factor in the latest price-sensitive company announcements or qualitative material. Simply Wall St has no position in any stocks mentioned.
About SZSE:000839
CITIC Guoan Information Industry
CITIC Guoan Information Industry Co., Ltd.
Slightly overvalued with questionable track record.
Market Insights

Community Narratives

