Zhewen Interactive Group Co., Ltd. (SHSE:600986) Soars 25% But It's A Story Of Risk Vs Reward
Zhewen Interactive Group Co., Ltd. (SHSE:600986) shareholders are no doubt pleased to see that the share price has bounced 25% in the last month, although it is still struggling to make up recently lost ground. Unfortunately, the gains of the last month did little to right the losses of the last year with the stock still down 13% over that time.
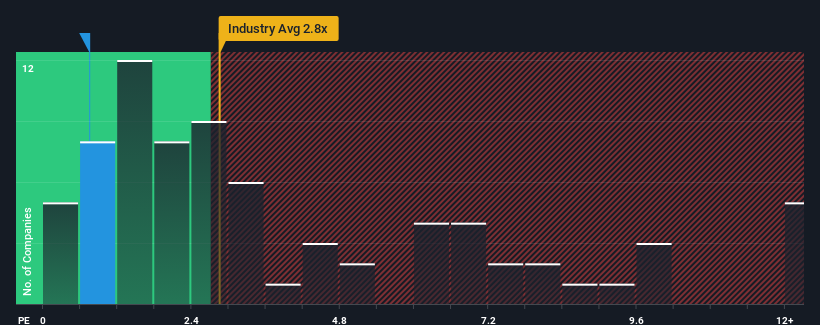
In spite of the firm bounce in price, Zhewen Interactive Group may still look like a strong buying opportunity at present with its price-to-sales (or "P/S") ratio of 0.7x, considering almost half of all companies in the Media industry in China have P/S ratios greater than 2.8x and even P/S higher than 7x aren't out of the ordinary. Although, it's not wise to just take the P/S at face value as there may be an explanation why it's so limited.
View our latest analysis for Zhewen Interactive Group

What Does Zhewen Interactive Group's Recent Performance Look Like?
Zhewen Interactive Group hasn't been tracking well recently as its declining revenue compares poorly to other companies, which have seen some growth in their revenues on average. Perhaps the P/S remains low as investors think the prospects of strong revenue growth aren't on the horizon. If this is the case, then existing shareholders will probably struggle to get excited about the future direction of the share price.
Want the full picture on analyst estimates for the company? Then our free report on Zhewen Interactive Group will help you uncover what's on the horizon.Do Revenue Forecasts Match The Low P/S Ratio?
Zhewen Interactive Group's P/S ratio would be typical for a company that's expected to deliver very poor growth or even falling revenue, and importantly, perform much worse than the industry.
Retrospectively, the last year delivered a frustrating 22% decrease to the company's top line. This has erased any of its gains during the last three years, with practically no change in revenue being achieved in total. Accordingly, shareholders probably wouldn't have been overly satisfied with the unstable medium-term growth rates.
Looking ahead now, revenue is anticipated to climb by 28% during the coming year according to the two analysts following the company. That's shaping up to be materially higher than the 20% growth forecast for the broader industry.
With this information, we find it odd that Zhewen Interactive Group is trading at a P/S lower than the industry. Apparently some shareholders are doubtful of the forecasts and have been accepting significantly lower selling prices.
The Final Word
Zhewen Interactive Group's recent share price jump still sees fails to bring its P/S alongside the industry median. Generally, our preference is to limit the use of the price-to-sales ratio to establishing what the market thinks about the overall health of a company.
A look at Zhewen Interactive Group's revenues reveals that, despite glowing future growth forecasts, its P/S is much lower than we'd expect. The reason for this depressed P/S could potentially be found in the risks the market is pricing in. It appears the market could be anticipating revenue instability, because these conditions should normally provide a boost to the share price.
And what about other risks? Every company has them, and we've spotted 2 warning signs for Zhewen Interactive Group you should know about.
It's important to make sure you look for a great company, not just the first idea you come across. So if growing profitability aligns with your idea of a great company, take a peek at this free list of interesting companies with strong recent earnings growth (and a low P/E).
Valuation is complex, but we're here to simplify it.
Discover if Zhewen Interactive Group might be undervalued or overvalued with our detailed analysis, featuring fair value estimates, potential risks, dividends, insider trades, and its financial condition.
Access Free AnalysisHave feedback on this article? Concerned about the content? Get in touch with us directly. Alternatively, email editorial-team (at) simplywallst.com.
This article by Simply Wall St is general in nature. We provide commentary based on historical data and analyst forecasts only using an unbiased methodology and our articles are not intended to be financial advice. It does not constitute a recommendation to buy or sell any stock, and does not take account of your objectives, or your financial situation. We aim to bring you long-term focused analysis driven by fundamental data. Note that our analysis may not factor in the latest price-sensitive company announcements or qualitative material. Simply Wall St has no position in any stocks mentioned.
About SHSE:600986
Zhewen Interactive Group
Provides intelligent marketing solutions in China, Hong Kong, Macau, Taiwan, and internationally.
Acceptable track record with mediocre balance sheet.
Market Insights
Community Narratives


