
Advertisement
With A 25% Price Drop For Inmyshow Digital Technology(Group)Co.,Ltd. (SHSE:600556) You'll Still Get What You Pay For
Inmyshow Digital Technology(Group)Co.,Ltd. (SHSE:600556) shareholders won't be pleased to see that the share price has had a very rough month, dropping 25% and undoing the prior period's positive performance. Instead of being rewarded, shareholders who have already held through the last twelve months are now sitting on a 46% share price drop.
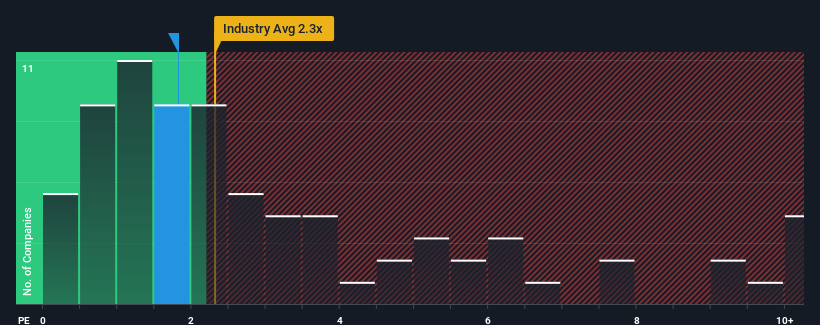
In spite of the heavy fall in price, you could still be forgiven for feeling indifferent about Inmyshow Digital Technology(Group)Co.Ltd's P/S ratio of 1.8x, since the median price-to-sales (or "P/S") ratio for the Media industry in China is also close to 2.3x. While this might not raise any eyebrows, if the P/S ratio is not justified investors could be missing out on a potential opportunity or ignoring looming disappointment.
See our latest analysis for Inmyshow Digital Technology(Group)Co.Ltd
How Inmyshow Digital Technology(Group)Co.Ltd Has Been Performing
Inmyshow Digital Technology(Group)Co.Ltd hasn't been tracking well recently as its declining revenue compares poorly to other companies, which have seen some growth in their revenues on average. Perhaps the market is expecting its poor revenue performance to improve, keeping the P/S from dropping. However, if this isn't the case, investors might get caught out paying too much for the stock.
Keen to find out how analysts think Inmyshow Digital Technology(Group)Co.Ltd's future stacks up against the industry? In that case, our free report is a great place to start.How Is Inmyshow Digital Technology(Group)Co.Ltd's Revenue Growth Trending?
Inmyshow Digital Technology(Group)Co.Ltd's P/S ratio would be typical for a company that's only expected to deliver moderate growth, and importantly, perform in line with the industry.
Taking a look back first, the company's revenue growth last year wasn't something to get excited about as it posted a disappointing decline of 4.0%. However, a few very strong years before that means that it was still able to grow revenue by an impressive 48% in total over the last three years. Although it's been a bumpy ride, it's still fair to say the revenue growth recently has been more than adequate for the company.
Turning to the outlook, the next year should generate growth of 19% as estimated by the three analysts watching the company. With the industry predicted to deliver 20% growth , the company is positioned for a comparable revenue result.
In light of this, it's understandable that Inmyshow Digital Technology(Group)Co.Ltd's P/S sits in line with the majority of other companies. Apparently shareholders are comfortable to simply hold on while the company is keeping a low profile.
The Key Takeaway
Following Inmyshow Digital Technology(Group)Co.Ltd's share price tumble, its P/S is just clinging on to the industry median P/S. While the price-to-sales ratio shouldn't be the defining factor in whether you buy a stock or not, it's quite a capable barometer of revenue expectations.
Our look at Inmyshow Digital Technology(Group)Co.Ltd's revenue growth estimates show that its P/S is about what we expect, as both metrics follow closely with the industry averages. Right now shareholders are comfortable with the P/S as they are quite confident future revenue won't throw up any surprises. If all things remain constant, the possibility of a drastic share price movement remains fairly remote.
We don't want to rain on the parade too much, but we did also find 2 warning signs for Inmyshow Digital Technology(Group)Co.Ltd that you need to be mindful of.
If companies with solid past earnings growth is up your alley, you may wish to see this free collection of other companies with strong earnings growth and low P/E ratios.
New: AI Stock Screener & Alerts
Our new AI Stock Screener scans the market every day to uncover opportunities.
• Dividend Powerhouses (3%+ Yield)
• Undervalued Small Caps with Insider Buying
• High growth Tech and AI Companies
Or build your own from over 50 metrics.
Have feedback on this article? Concerned about the content? Get in touch with us directly. Alternatively, email editorial-team (at) simplywallst.com.
This article by Simply Wall St is general in nature. We provide commentary based on historical data and analyst forecasts only using an unbiased methodology and our articles are not intended to be financial advice. It does not constitute a recommendation to buy or sell any stock, and does not take account of your objectives, or your financial situation. We aim to bring you long-term focused analysis driven by fundamental data. Note that our analysis may not factor in the latest price-sensitive company announcements or qualitative material. Simply Wall St has no position in any stocks mentioned.
About SHSE:600556
Inmyshow Digital Technology(Group)Co.Ltd
Inmyshow Digital Technology(Group)Co.,Ltd.
Excellent balance sheet and fair value.
Market Insights

Advertisement
Community Narratives
MicroVision will explode future revenue by 380.37% with a vision towards success
Fair Value US$60|98.4% undervalued
TH
Community Contributor
The Indispensable Artery for a New North American Economy
Fair Value CA$132.87|0.8% undervalued
TI
Community Contributor
Recently Updated Narratives
RE

RecMag on Proximus ·
Proximus: The State-Backed Backup Plan with 7% Gross Yield and 15% Currency Upside.
Fair Value:€17.1359.3% undervalued
29 followersusers have followed this narrative
0 commentsusers have commented on this narrative
0 likesusers have liked this narrative
SW

swift11 on DXC Technology ·
CEO: We are winners in the long term in the AI world
Fair Value:US$17.4624.9% undervalued
1 followerusers have followed this narrative
0 commentsusers have commented on this narrative
0 likesusers have liked this narrative
AL

AlexLovell on Rocket Lab ·
Early mover in a fast growing industry. Likely to experience share price volatility as they scale
Fair Value:US$16.25158.0% overvalued
2 followersusers have followed this narrative
0 commentsusers have commented on this narrative
0 likesusers have liked this narrative
Popular Narratives
TH

TheWallstreetKing on MicroVision ·
MicroVision will explode future revenue by 380.37% with a vision towards success
Fair Value:US$6098.4% undervalued
99 followersusers have followed this narrative
10 commentsusers have commented on this narrative
19 likesusers have liked this narrative
OS


oscargarcia on Alphabet ·
The company that turned a verb into a global necessity and basically runs the modern internet, digital ads, smartphones, maps, and AI.
Fair Value:US$3405.9% undervalued
137 followersusers have followed this narrative
6 commentsusers have commented on this narrative
18 likesusers have liked this narrative
AN


AnalystConsensusTarget on NVIDIA ·
NVDA: Expanding AI Demand Will Drive Major Data Center Investments Through 2026
Fair Value:US$232.7922.6% undervalued
929 followersusers have followed this narrative
6 commentsusers have commented on this narrative
22 likesusers have liked this narrative