
Advertisement
There's No Escaping Shenzhen Dynanonic Co., Ltd's (SZSE:300769) Muted Revenues Despite A 32% Share Price Rise
Shenzhen Dynanonic Co., Ltd (SZSE:300769) shares have had a really impressive month, gaining 32% after a shaky period beforehand. But the last month did very little to improve the 61% share price decline over the last year.
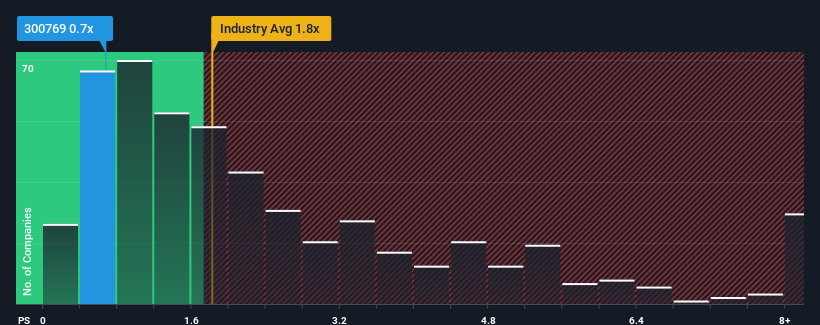
Although its price has surged higher, Shenzhen Dynanonic may still be sending bullish signals at the moment with its price-to-sales (or "P/S") ratio of 0.7x, since almost half of all companies in the Chemicals industry in China have P/S ratios greater than 1.8x and even P/S higher than 4x are not unusual. Although, it's not wise to just take the P/S at face value as there may be an explanation why it's limited.
Check out our latest analysis for Shenzhen Dynanonic
What Does Shenzhen Dynanonic's Recent Performance Look Like?
Shenzhen Dynanonic could be doing better as its revenue has been going backwards lately while most other companies have been seeing positive revenue growth. It seems that many are expecting the poor revenue performance to persist, which has repressed the P/S ratio. If you still like the company, you'd be hoping this isn't the case so that you could potentially pick up some stock while it's out of favour.
Keen to find out how analysts think Shenzhen Dynanonic's future stacks up against the industry? In that case, our free report is a great place to start.What Are Revenue Growth Metrics Telling Us About The Low P/S?
Shenzhen Dynanonic's P/S ratio would be typical for a company that's only expected to deliver limited growth, and importantly, perform worse than the industry.
Retrospectively, the last year delivered a frustrating 48% decrease to the company's top line. In spite of this, the company still managed to deliver immense revenue growth over the last three years. Therefore, it's fair to say the revenue growth recently has been superb for the company, but investors will want to ask why it is now in decline.
Turning to the outlook, the next year should bring diminished returns, with revenue decreasing 0.3% as estimated by the ten analysts watching the company. That's not great when the rest of the industry is expected to grow by 21%.
In light of this, it's understandable that Shenzhen Dynanonic's P/S would sit below the majority of other companies. Nonetheless, there's no guarantee the P/S has reached a floor yet with revenue going in reverse. Even just maintaining these prices could be difficult to achieve as the weak outlook is weighing down the shares.
The Final Word
The latest share price surge wasn't enough to lift Shenzhen Dynanonic's P/S close to the industry median. We'd say the price-to-sales ratio's power isn't primarily as a valuation instrument but rather to gauge current investor sentiment and future expectations.
It's clear to see that Shenzhen Dynanonic maintains its low P/S on the weakness of its forecast for sliding revenue, as expected. Right now shareholders are accepting the low P/S as they concede future revenue probably won't provide any pleasant surprises. Unless these conditions improve, they will continue to form a barrier for the share price around these levels.
Don't forget that there may be other risks. For instance, we've identified 1 warning sign for Shenzhen Dynanonic that you should be aware of.
If these risks are making you reconsider your opinion on Shenzhen Dynanonic, explore our interactive list of high quality stocks to get an idea of what else is out there.
New: Manage All Your Stock Portfolios in One Place
We've created the ultimate portfolio companion for stock investors, and it's free.
• Connect an unlimited number of Portfolios and see your total in one currency
• Be alerted to new Warning Signs or Risks via email or mobile
• Track the Fair Value of your stocks
Have feedback on this article? Concerned about the content? Get in touch with us directly. Alternatively, email editorial-team (at) simplywallst.com.
This article by Simply Wall St is general in nature. We provide commentary based on historical data and analyst forecasts only using an unbiased methodology and our articles are not intended to be financial advice. It does not constitute a recommendation to buy or sell any stock, and does not take account of your objectives, or your financial situation. We aim to bring you long-term focused analysis driven by fundamental data. Note that our analysis may not factor in the latest price-sensitive company announcements or qualitative material. Simply Wall St has no position in any stocks mentioned.
About SZSE:300769
Shenzhen Dynanonic
Engages in the research and development, production, and sale of materials for lithium-ion batteries in China.
High growth potential and good value.
Similar Companies
Market Insights

Advertisement
Community Narratives
MicroVision will explode future revenue by 380.37% with a vision towards success
Fair Value US$60|98.4% undervalued
TH
Community Contributor
The Indispensable Artery for a New North American Economy
Fair Value CA$132.87|0.8% undervalued
TI
Community Contributor
Recently Updated Narratives
AL

AlexLovell on Rocket Lab ·
Early mover in a fast growing industry. Likely to experience share price volatility as they scale
Fair Value:US$16.25158.0% overvalued
1 followerusers have followed this narrative
0 commentsusers have commented on this narrative
0 likesusers have liked this narrative
MA


MarkoVT on ANYCOLOR ·
Near zero debt, Japan centric focus provides future growth
Fair Value:JP¥7.61k15.3% undervalued
1 followerusers have followed this narrative
0 commentsusers have commented on this narrative
0 likesusers have liked this narrative
CO

composite32 on TAV Havalimanlari Holding ·
TAV Havalimanlari Holding will fly high with 25.68% revenue growth
Fair Value:₺545.1648.6% undervalued
3 followersusers have followed this narrative
0 commentsusers have commented on this narrative
0 likesusers have liked this narrative
Popular Narratives
TH

TheWallstreetKing on MicroVision ·
MicroVision will explode future revenue by 380.37% with a vision towards success
Fair Value:US$6098.4% undervalued
95 followersusers have followed this narrative
10 commentsusers have commented on this narrative
18 likesusers have liked this narrative
OS


oscargarcia on Alphabet ·
The company that turned a verb into a global necessity and basically runs the modern internet, digital ads, smartphones, maps, and AI.
Fair Value:US$3405.9% undervalued
136 followersusers have followed this narrative
6 commentsusers have commented on this narrative
18 likesusers have liked this narrative
AN


AnalystConsensusTarget on NVIDIA ·
NVDA: Expanding AI Demand Will Drive Major Data Center Investments Through 2026
Fair Value:US$232.7922.6% undervalued
929 followersusers have followed this narrative
6 commentsusers have commented on this narrative
22 likesusers have liked this narrative